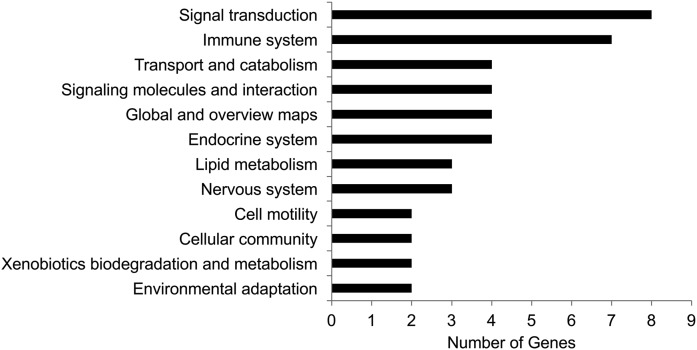
Fig. 7.
Differential expressed hepatic genes in inulin-fed mice versus control mice. Genes with a fold change inulin/control ≥2 and posterior probability of equal expression ≤0.05 were considered as DEGs. The DEGs were subjected to GO functional enrichment analysis. The calculated P-value goes through Bonferroni correction. The pathways that have more than two genes enriched are shown. See also supplemental Table S1 for raw data.

