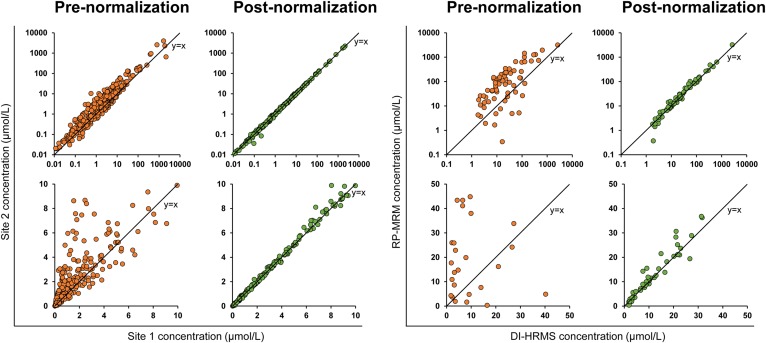
Fig. 5.
Inter-site and inter-method variability is improved after normalizing to a common reference sample. Comparison of lipid concentrations measured in the same samples with the same RP-MRM method in two different laboratories (Site 1 and Site 2, respectively; left), and with a DI-HRMS method and a RP-MRM method (right). Top row shows log-scaled axes. Bottom row shows a zoomed inset on a linear scale for lipids present at low concentrations. Black line indicates perfect comparability (y = x). Normalization to a common reference sample harmonizes results at different sites using the same method (left). Some quantitative bias remains after normalization when the samples are analyzed with different instruments and methods (right).

