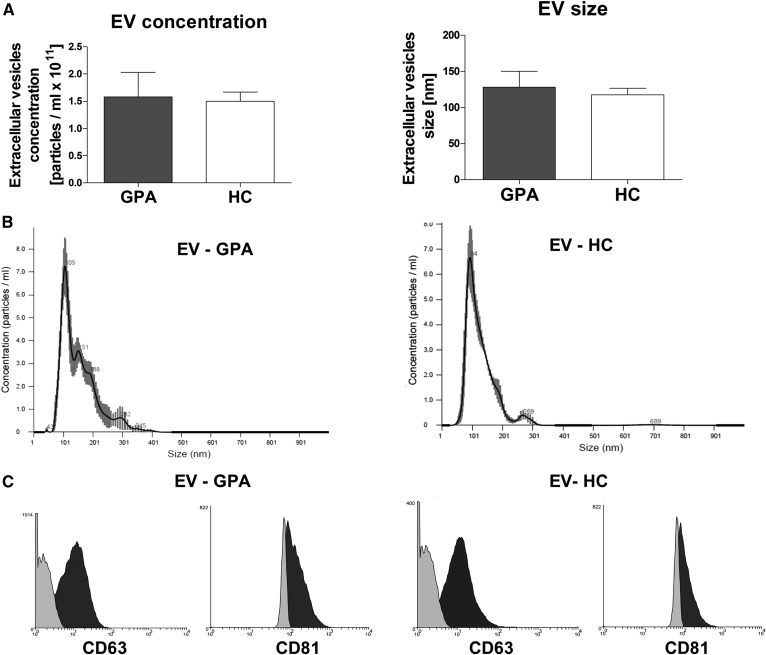
Fig. 1.
A: Concentration and size distribution of plasma-derived EVs. Results are presented as mean ± SD. PB, C: Representative histograms of size distribution (B) and CD63/CD81 expression (C) of EVs. Left panels: EVs isolated from GPA patient. Right panels: EVs isolated from healthy donor. In panel C, light gray indicates isotype control; dark gray indicates CD63 or CD81.

