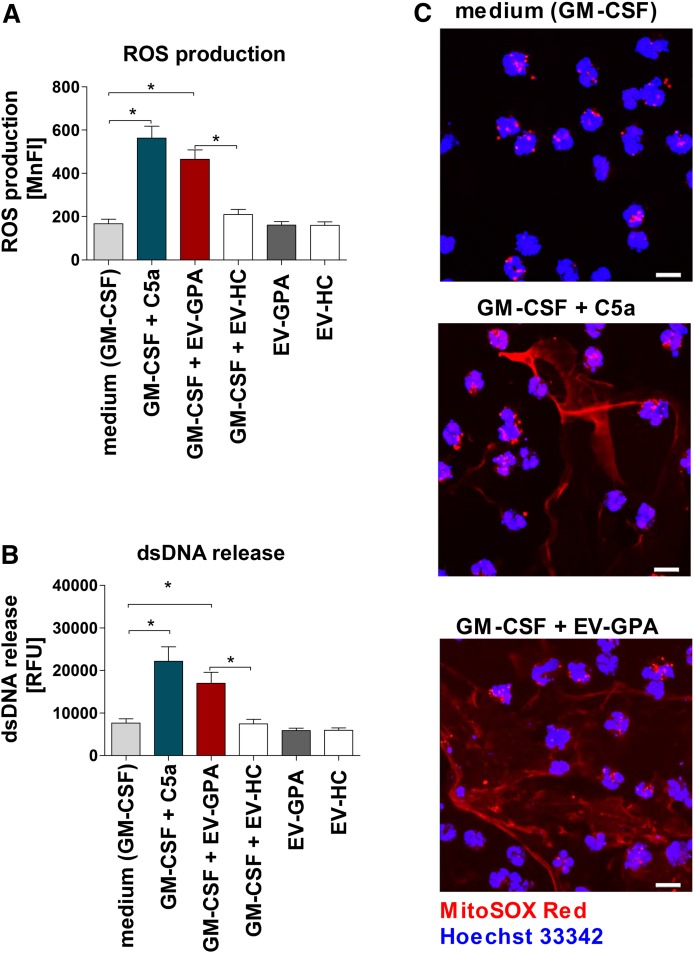
Fig. 2.
EVs isolated from GPA patients activate human neutrophils. Neutrophils were isolated from the blood of healthy donors (n = 6) and stimulated with C5a (positive control) or EV-GPAs (n = 10) and healthy controls (EV-HC; n = 10). In each experiment, cells were primed (GM-CSF, 25 ng/ml) or left unprimed for 15 min before stimulation in parallel experiments with EV-GPAs or EV-HCs. Each EV sample was tested with neutrophils from two different donors. A: Total ROS production by activated neutrophils was measured by flow cytometry. B: Quantification of dsDNA in supernatants of activated neutrophils was performed using PicoGreen fluorescent dye. C: Confocal microscopy. Representative images of extracellular DNA release following short-term stimulation (total 45 min) of human neutrophils with the stimuli. Cells were labeled with 5 μM of MitoSOX Red to stain the extracellular DNA and the cell nucleus was stained with 1 μg/ml Hoechst 33342. Scale bars are 10 μm. The images were acquired by confocal scanning microscope. Results are presented as mean ± SD of mean fluorescence intensity (MnFI) or relative fluorescence units (RFU) and were tested with the use of ANOVA with Tukey’s post hoc test. *P < 0.05 compared with nonstimulated control.

