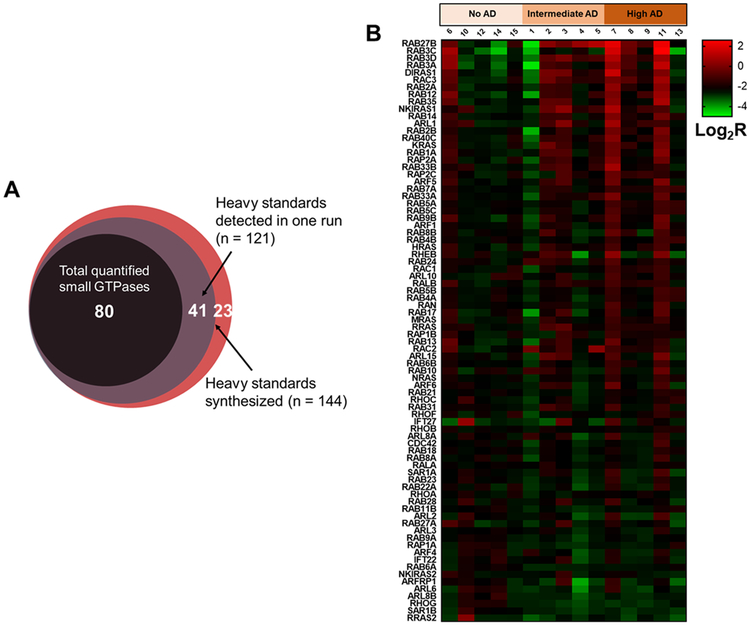
Figure 3.
Relative quantification of small GTPases in brain tissues obtained from Alzheimer’s disease (AD) patients. (A) A Venn diagram depicting the overlap between quantified small GTPases, quantified SIL standards, and total targeted small GTPases in the library; (B) a heat map showing the relative quantification of small GTPases in post-mortem brain tissues of AD patients. Each column represents relative quantification results (in log2 scale) obtained from one biological replicate, and each row represents one small GTPase quantified, where sample codes and disease stages are labeled. The results were normalized to the mean values of the control group (no AD), and the quantified small GTPases were ranked by highest to lowest fold changes in mean of R(high AD/no AD).

