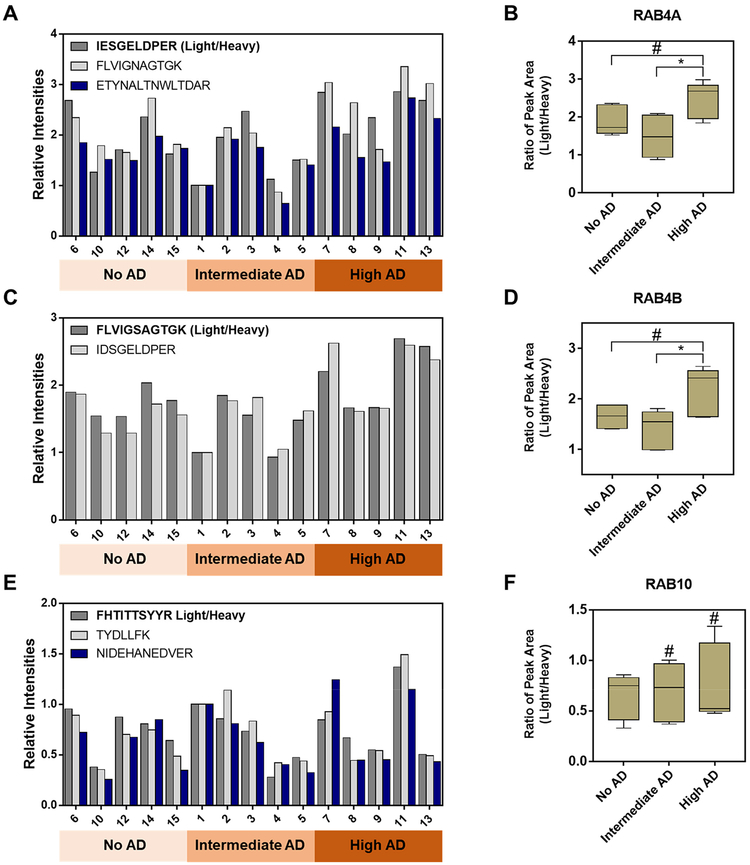
Figure 4. Representative MRM quantification results for three synaptic GTPases, RAB4A, RAB4B, and RAB10.
(A) A bar graph illustrating the MRM-based quantification results obtained from three peptides derived from RAB4A; (B) a box and whisker plot summarizing the quantification results in panel (A); (C) a bar graph illustrating the MRM-based quantification results obtained from two peptides derived from RAB4B; (D) a box and whisker plot summarizing the quantification results in panel (C); (E) a bar graph illustrating the MRM-based quantification results obtained from three peptides derived from RAB10; (F) a box and whisker plot summarizing the quantification results in panel (E). In the box and whisker plots, the horizontal bar in the box, top/bottom edges of the box, and whiskers indicate the mean, quartiles, and the maximum range, respectively. Tukey’s multiple comparison test was performed to calculate the p values (#, p > 0.05; *, 0.01 ≤ p < 0.05).

