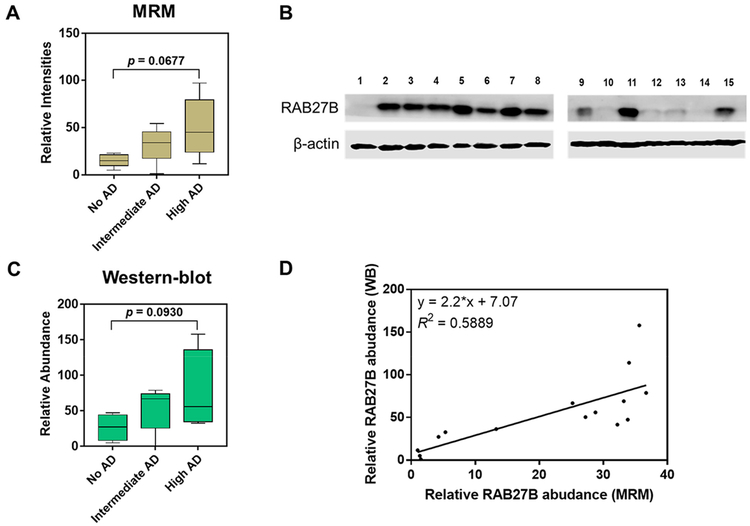
Figure 5.
Substantial up-regulation of RAB27B in higher stages of AD. (A) A box and whisker plot summarizing the LC–MRM quantification results of the protein levels of RAB27B among the three patient groups; (B) Western blot analysis of RAB27B in the 15 human brain tissue samples; (C) a box and whisker plot summarizing the Western blot quantification results for the relative levels of RAB27B in the brain tissues of the three patient groups. In the box and whisker plots, the horizontal bar in the box, top/bottom edges of the box, and whiskers indicate the mean, quartiles, and the maximum range, respectively; (D) linear regression analysis for the quantification results obtained by Western blot (WB) and LC–MRM assay. Tukey’s multiple comparisons test was performed to calculate the p values.

