Fig. 5.
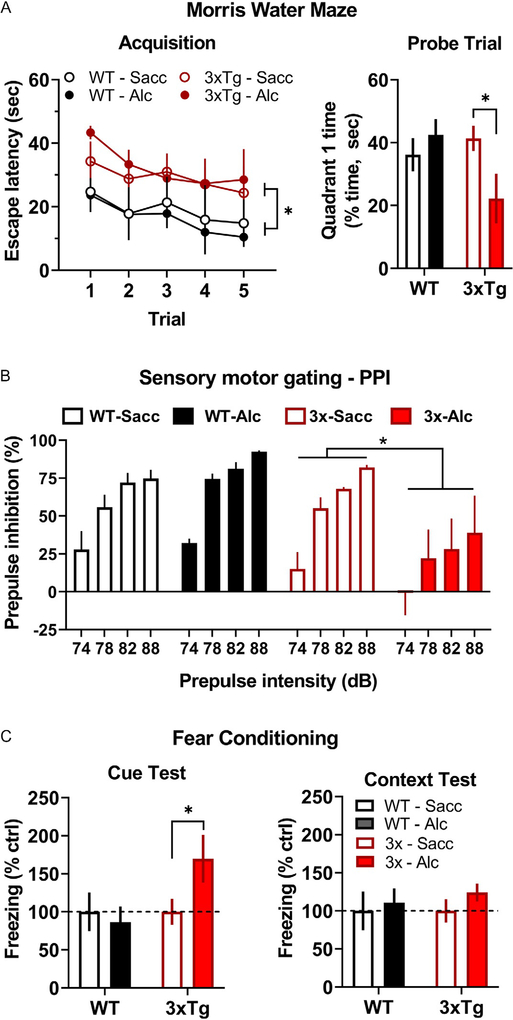
Alcohol drinking-induced behavioral deficits in 3xTg-AD mice. (A, left) Average escape latency (s) plotted as a function of trial during Morris Water Maze acquisition. * indicates significant main effect between genotypes over all trials. (A, right) Percentage of time (s) spent in the quadrant of the Morris Water Maze that previously contained the escape platform. * indicates significant difference between alcohol vs saccharin exposed 3xTg-AD mice, P < 0.05. (B) Average prepulse inhibition (%) plotted as a function of stimulus intensity (dB). * indicates statistically significant main effect between 3xTg-AD mice that consumed alcohol vs saccharin. (C, left) Cued fear response plotted as average freezing (% control seconds) as a function of genotype and alcohol intake condition. * indicates significant difference between 3xTg-AD mice that consumed alcohol vs saccharin, P < 0.05. (C, right) Context-dependent fear response plotted as freezing (% control) as a function of genotype and treatment conditions. Abbreviations: Saccharin (Sacc), Alcohol (Alc).

