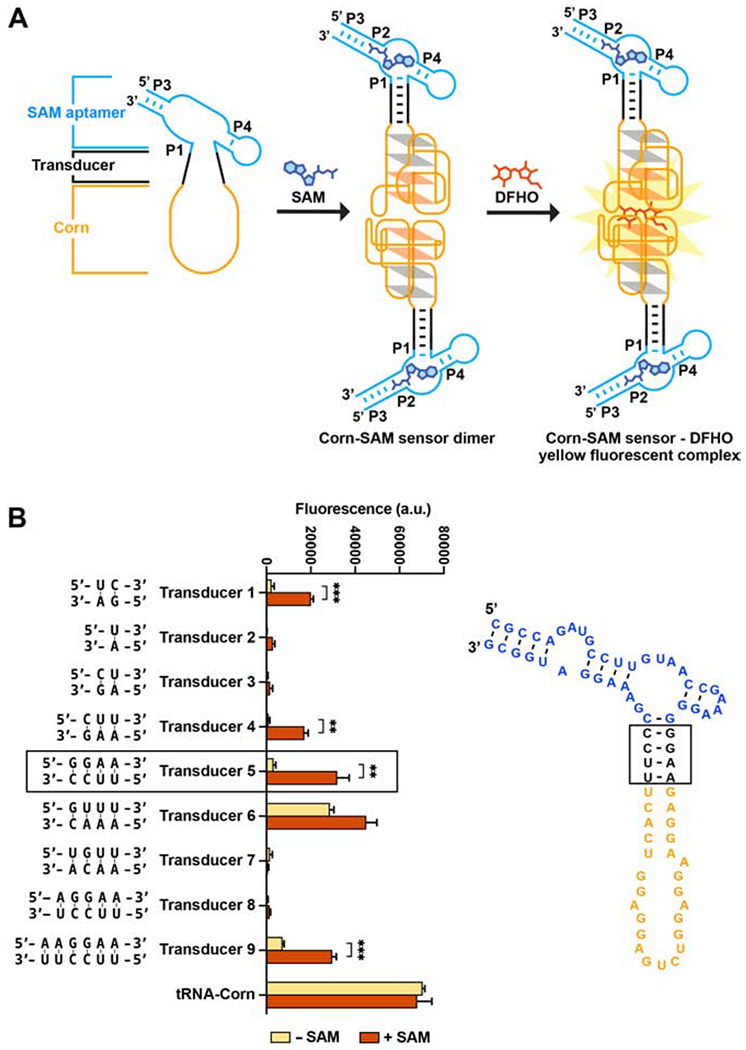
Figure 2. Design of a Corn-SAM sensor.

(A) Schematic of SAM binding to the SAM aptamer, which induces folding, dimerization, and fluorogenic activation of Corn.
(B) Each indicated transducer sequence was tested for its ability to mediate SAM-induced fluorescence. In vitro transcribed Corn-SAM sensor RNA (1 μM) was incubated with 10 μM DFHO and 0.1 mM SAM for 1 h at 37°0. Fluorescence was measured (ex 505 nm; em 545 nm). The optimal transducer is indicated in a black-lined box. Mean and SEM values are shown in the plot (n = 3). *** P = 0.0004 (Transducer 1), ** P = 0.0010 (Transducer 2), ** P = 0.0067 (Transducer 5), *** P = 0.0004 (Transducer 9)
