
Fig. 6.
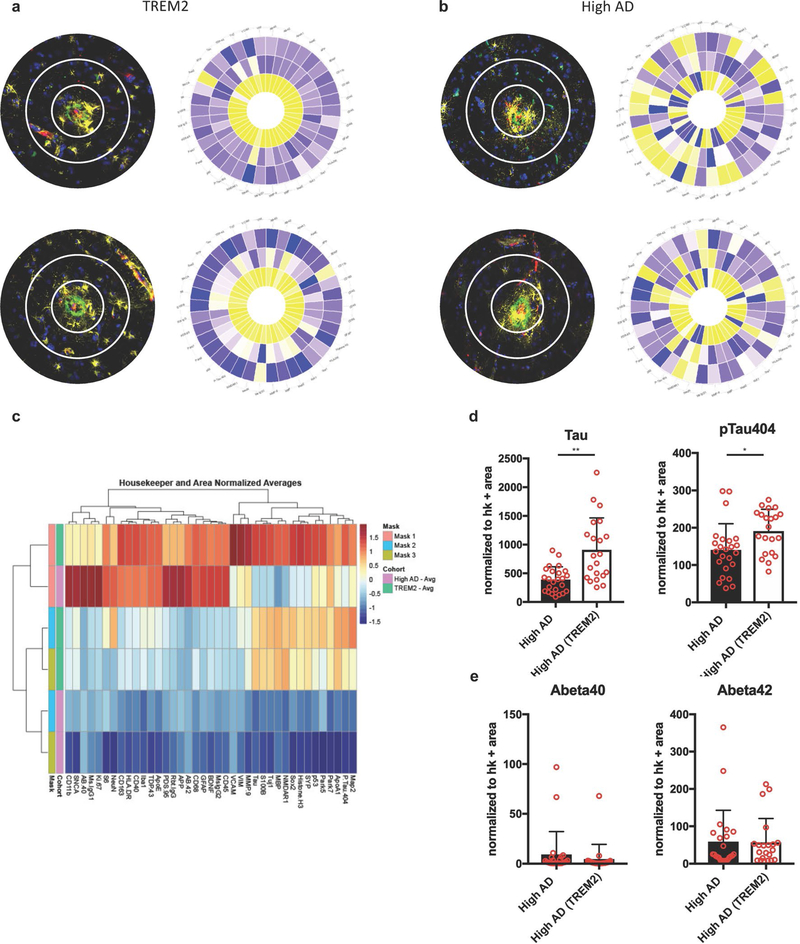
Altered plaque microenvironment in TREM2 cases. Targeting images (a, b, left row) for multiplexed protein analysis (green = Aβ, yellow—Iba1, blue = nuclei) with three concentric circles around the plaque center. a, b Radial heatmaps of protein quantification within three regions around the plaque center for TREM2 (a, right row) and high AD (b, right row). c Heat map of unbiased clustering of multiplexed protein data for both experimental groups and concentric regions around plaque center. Color legend for relative protein expression and experimental group/zone. Mask1 refers to plaque center, Mask2 refers to middle ring and Mask3 refers to outer most ring for each plaque. d Graphical representation of protein data for phosphorylated tau (pSer396/pSer404) for high AD (black bars) and TREM2 (white bars) per concentric region around plaques. Red circles represent average protein data per case per region. Error bars represent standard error of mean. e Graphical representation of protein data for Aβ42 for high AD (black bars) and TREM2 (white bars) per concentric region around plaques. Red circles represent average protein data per case per region. Error bars represent standard error of the mean