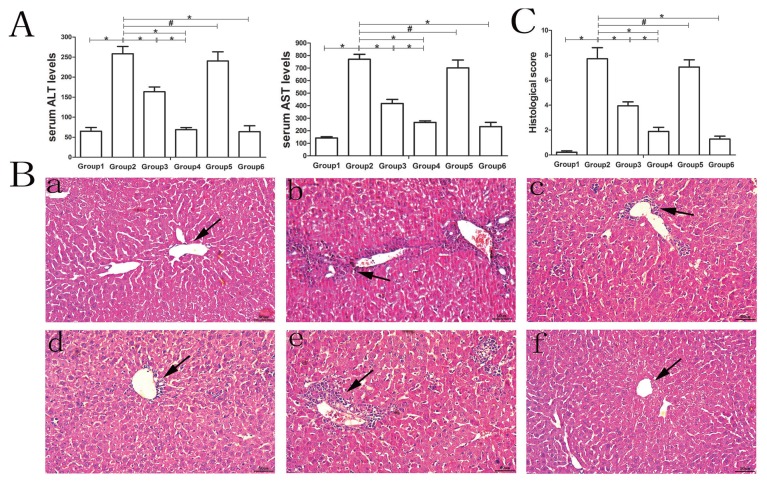
Fig. 2. Liver injury in hepatic S100/CFA-induced AIH mice.
The automatic biochemistry analyzer was used to evaluate the serum levels of ALT and AST. (A) The serum levels of ALT and AST in the different groups of mice. Data are presented as mean ± SD from six mice. Group 1, control group; Group 2, model group; Group 3, MSC-exosomes-treated group; Group 4, MSC-exosomesmiR-223-3p-treated group; Group 5, MSC-exosomesmiR-223-3p(i)-treated group; Group 6, drug-treated group (the drug is defined as steroids and azathioprine). (B) The typical liver section stained with H&E at a magnification of ×200. Scale bars = 50 μm. Arrows indicate the infiltration of mononuclear cells in the centrilobular as well as intralobular inflammatory lesions and necrosis. Label a, control group; b, model group; c, MSC-exosomes-treated group; d, MSC-exosomesmiR-223-3p-treated group; e, MSC-exosomesmiR-223-3p(i)-treated group; f, drug-treated group. (C) The histological scoring of each group according to the Ishak grading system. Three histological sections per animal were examined. Group 1, control group; Group 2, model group; Group 3, MSC-exosomes-treated group; Group 4, MSC-exosomesmiR-223-3p-treated group; Group 5, MSC-exosomesmiR-223-3p(i)-treated group; Group 6, drug-treated group. Data are presented as mean ± SD from six mice. *P < 0.05, #P > 0.05.

