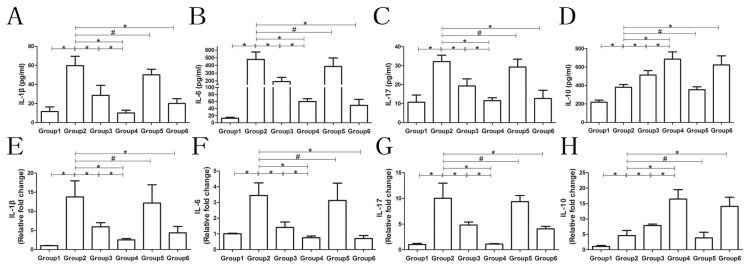
Fig. 3. The levels of inflammatory cytokines in mouse serum and liver.
ELISA and qRT-PCR were employed to investigate serum and liver levels of inflammatory cytokines. (A-D) The serum levels of IL-1β, IL-6, IL-17, and IL-10, respectively. (E-H) The liver levels of IL-1β, IL-6, IL-17, and IL-10, respectively. For the liver, the data are expressed as fold changes relative to the control group. All histograms are presented as mean ± SD, n = 6. *P < 0.05, #P > 0.05. Group 1, control group; Group 2, model group; Group 3, MSC-exosomes-treated group; Group 4, MSC-exosomesmiR-223-3p-treated group; Group 5, MSC-exosomesmiR-223-3p(i)-treated group; Group 6, drug-treated group (the drug is defined as steroids and azathioprine).

