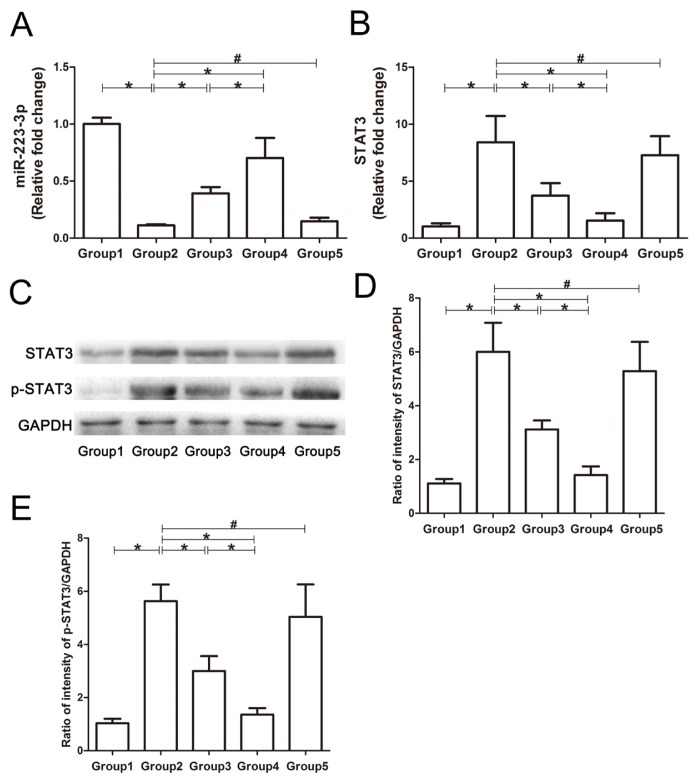
Fig. 5. Expression of miR-223-3p, p-STAT3, and STAT3 in the livers of different groups of mice.
Western blotting and qRT-PCR were used to analyze the expression of miR-223-3p, p-STAT3 and STAT3 in the livers of mice in each group. For the PCR results, the data are expressed as fold changes relative to the control group. (A) The expression of miR-223-3p in the liver. (B) The expression of STAT3 mRNA in the liver. (C) The typical images of Western blots for p-STAT3, STAT3, and GAPDH. (D) The STAT3 levels normalized to GAPDH in the liver. (E) The p-STAT3 levels normalized to GAPDH in the liver. Group 1, control group; Group 2, model group; Group 3, MSC-exosomes-treated group; Group 4, MSC-exosomesmiR-223-3p-treated group; Group 5, MSC-exosomesmiR-223-3p(i)-treated group. Data are presented mean ± SD, n = 6. *P < 0.05, #P > 0.05.

