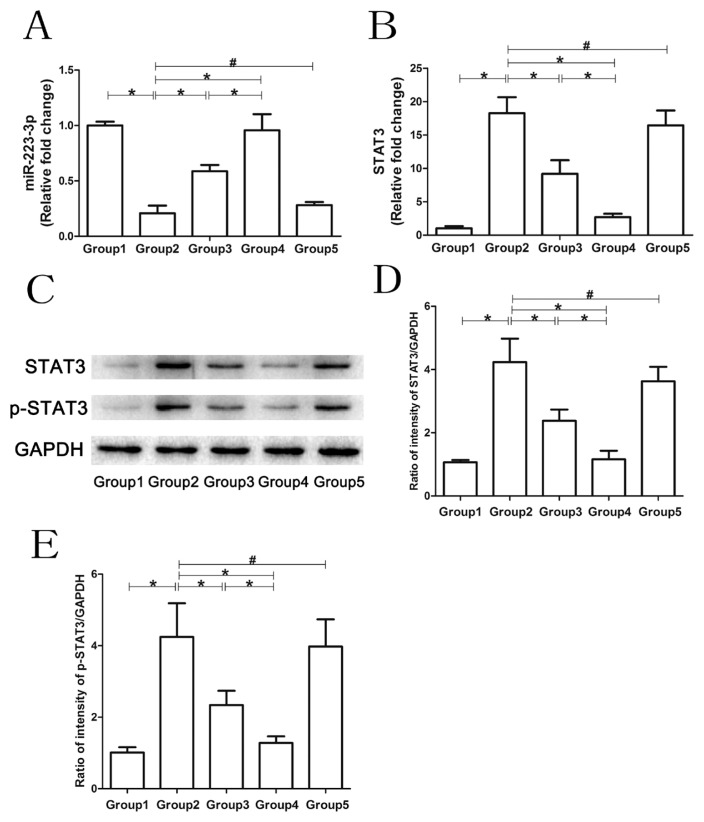
Fig. 7. Regulation of gene expression in macrophages by MSC-exosomes.
Western blotting and qRT-PCR were used to analyze the expression of miR-223-3p, p-STAT3 and STAT3 in macrophages in each group. For the PCR results, the data are expressed as fold changes relative to the control group. (A) The expression of miR-223-3p in macrophages in response to different treatments. (B) The STAT3 mRNA levels in macrophages in response to different treatments. (C-E) The protein levels of p-STAT3 and STAT3 in macrophages in response to different treatments. Group 1, control group; Group 2, LPS group; Group 3, LPS+MSC-exosomes group; Group 4, LPS+MSC-exosomesmiR-223-3p group; Group 5, LPS+MSC-exosomesmiR-223-3p(i) group. Data are presented mean ± SD, n = 6. *P < 0.05, #P > 0.05.

