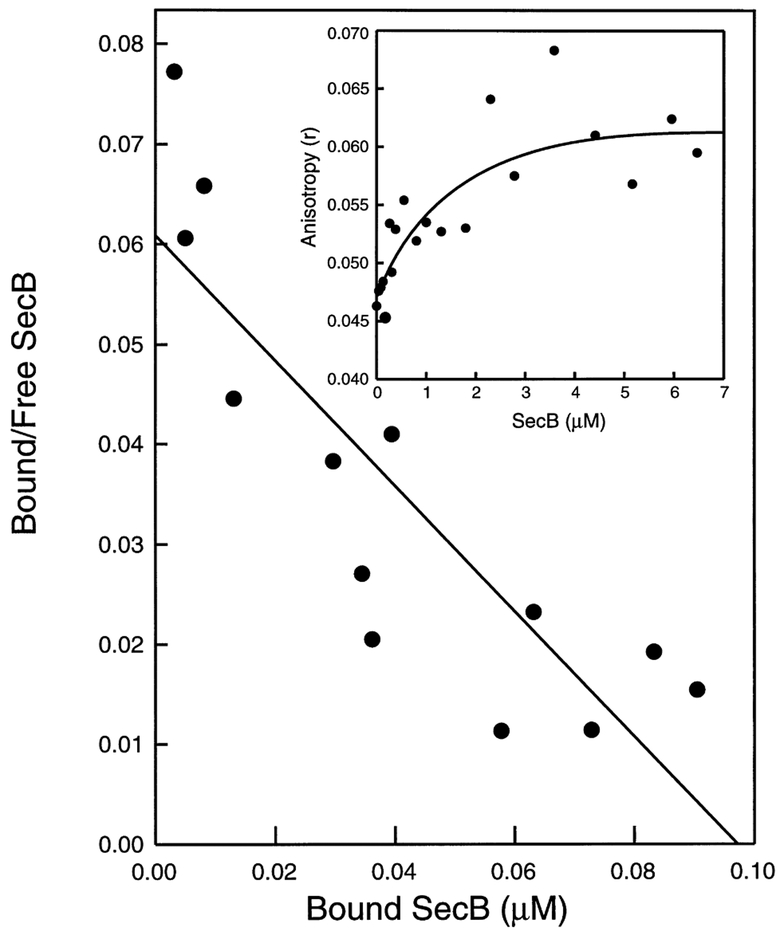
Fig. 2.
Anisotropy of E. coli SecA (Ru(bpy)2(dbpy)) in the presence of increasing SecB concentrations. Scatchard plot with a KD of 1.6 μM for the SecB tetramer assuming a complete ligandation of the SecA dimer. Inset, fitted line showing the increase in anisotropy plotted against the SecB (as tetramer) concentration in μM.

