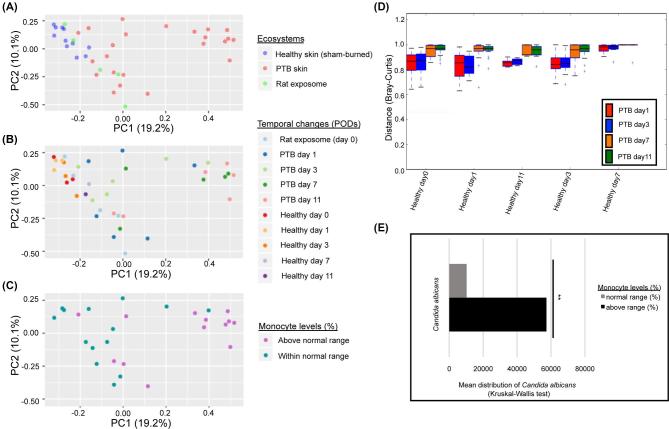
Figure 3.
Beta-diversity analysis of fungal communities in rat skin and exposome mycobiome. (A) Bray-Curtis analysis demonstrated a grouping of fungal specimens that separate a group of PTB specimens from remaining specimens. The rat exposome specimens were scattered between burned and unburned rat skin fungal communities. (B) When temporal changes are considered, majority of PTB of POD 7 and 11 skin specimens were separated into a cluster, while PTB specimens of POD 1 and 3 were scattered between the two clustering groups. The healthy skin specimens exhibited inter-animal variation across time. (C) Monocyte levels (%) obtained from CBC analysis of rat blood showed elevated monocyte values associated mostly with the PTB skin specimens of POD 7 and 11. Only a subgroup of rat skin specimens (27 rats) were randomly selected for undergoing CBC analysis. (D) Comparison distance plot of mycobiome sequence abundance (Bray-Curtis) over time for healthy and PTB rat skin specimens (Monte Carlo permutations = 2000) demonstrated a fungal shift between POD 3 and POD 7 in PTB skin relative to healthy skin community. (E) Significant enrichment of Candida in specimens exhibiting elevated monocyte levels (%) (FDR P = .03).

