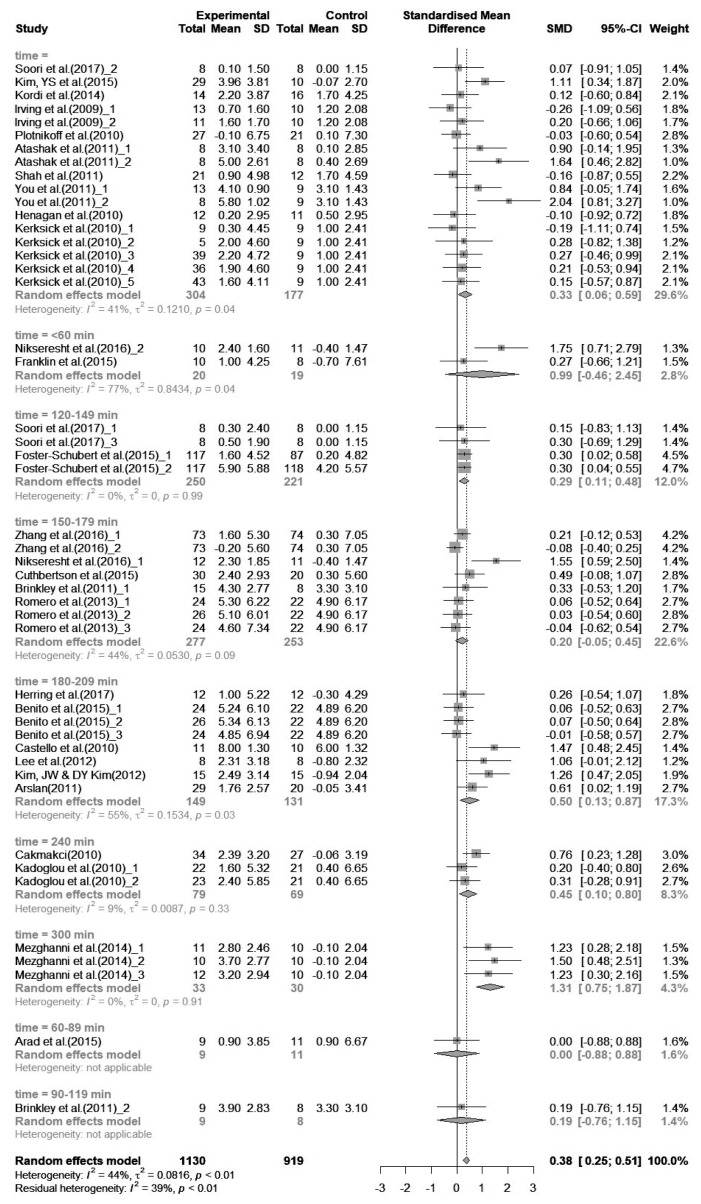
Figure 2.
Forest plot of % body fat by exercise time (minutes per week). The average standardized mean difference (SMD) for exercise time per week did not yield a specific pattern as the exercise time increased, possibly because of the small number of studies. “Total” in the figure indicates the number of subjects. Sixteen articles had several (2–5 pieces) comparisons, and each comparison was presented independently in the plot. SD, standard deviation; CI, confidence interval.

