
Fig. 1.
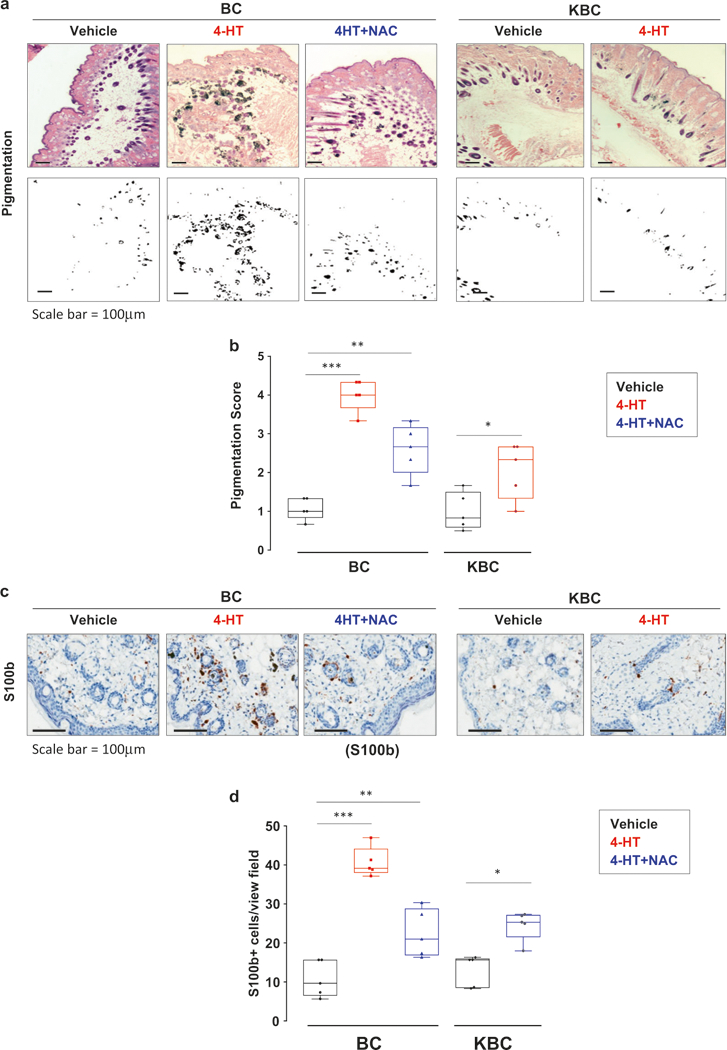
Klf9 deficiency or treatment with NAC inhibits BRAFV600E-induced hyperplasia. a H&E staining of skin sections derived from either BC or KBC mice 8 weeks after treatment with either vehicle (DMSO), 4-HT or 4-HT + NAC as described in the text (upper panel). Representative images shown (scale bar = 100 μm). Phase contrast image of section shown in upper panel highlighting pigmented regions in black (lower panel). Representative images shown. b To quantify the pigmentation in each specimen, three random fields from each H&E section (n = 5 sections per group) were imaged using bright field illumination. The images were then converted to black and white phase contrast images as shown in (a) lower panel using Adobe Photoshop. The area of pigmentation was measured using ImageJ software. To quantify the pigmentation in each specimen, three random fields from each H&E section (n = 5 sections) were imaged using bright field illumination. The images were then converted to black and white phase contrast images as show in (a) lower panel. A pigmentation score was assigned based on the area of pigmentation per total area ranging from (0 no pigmentation, 1 (0–10%), 2 (10–30%, 3 (30–50%), 4 (50–75%), 5 (75–100%) for each field. c Skin sections from mice described in (a) stained with S100b-specific antibodies using IHC. Representative images shown (scale bar = 100 μm). d Quantification of number of S100+ cells shown in panel c. S100b+ cells were counted in three random fields from each H&E section (n = 5 sections per group). Statistical comparisons were made using an unpaired Student’s t-test. (*p <0.05; **p <0.01; ***p <0.001)