
Fig. 4.
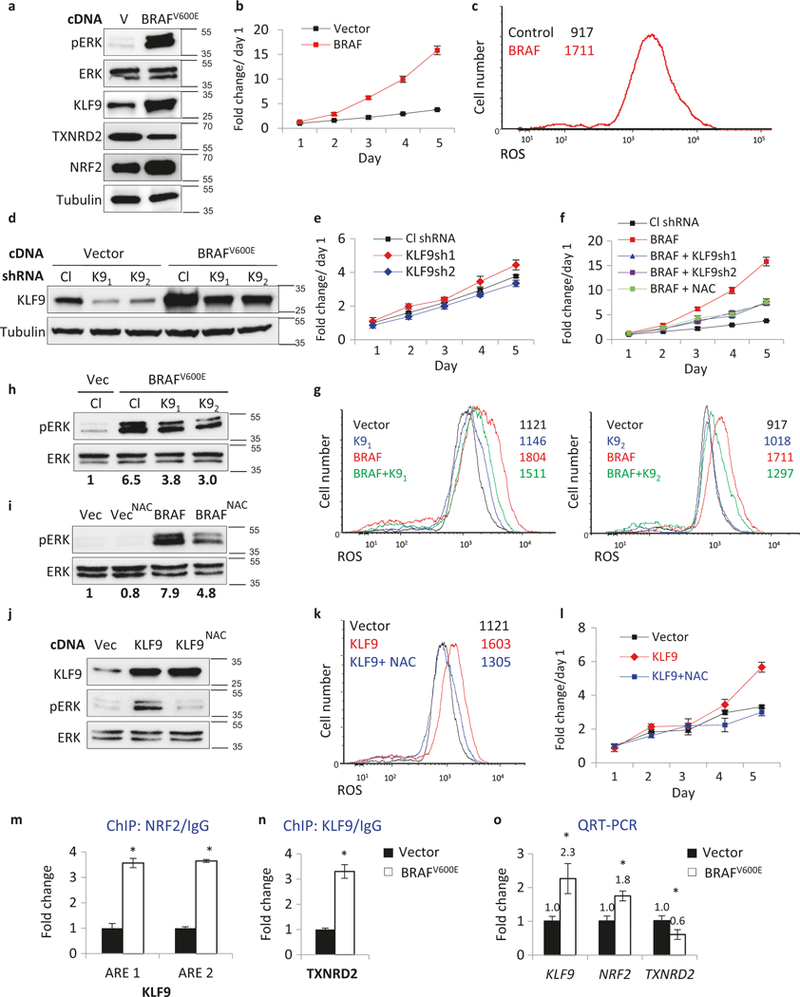
KLF9-dependent ROS regulate BRAFV600E activation of ERK1/2 and proliferation in NHM. a NHMs infected with an empty vector (V) or BRAFV600E-expressing vector (BRAFV600E) were probed in immunoblotting with indicated antibodies (representative immuno-blots shown). Molecular weights are indicated on the right in kDa. b NHMs described in (a) were counted in triplicates on indicated days using trypan blue exclusion assay starting 48 h after infection (*p < 0.05; Student’s t-test). c Cells described in (a) were stained with H2DCFDA (DCF) followed by FACS analysis to determine intracellular ROS. d NHMs were infected with control (Cl) or KLF9 (K9) shRNAs followed by transduction with empty vector (V) or BRAFV600E-expressing vector (BRAFV600E). Cells were probed in immunoblotting with indicated antibodies 48 h after second infection. Molecular weights are indicated on the right in kDa. e, f NHMs described in (d) were counted on indicated days in triplicates using trypan blue exclusion assay starting 48 h after infection (*p <0.05; Student’s t-test). g Cells described in (d) were stained with H2DCFDA (DCF) followed by FACS analysis to determine intracellular ROS. h NHMs were infected with control (Cl) or KLF9 (K9) shRNAs followed by transduction with empty vector (V) or BRAFV600E-expres-sing vector (BRAFV600E). Cells were probed in immunoblotting with indicated antibodies 48 h after infection. pERK and ERK signals were quantified using ImageQuant software. Molecular weights are indicated on the right in kDa. pERK/ERK signal ratio was identified and normalized by that in “Vec/Cl” lane. i NHMs infected with the empty vector (Vec) or BRAFV600E-expressing vector (BRAFV600E) were treated with 0.5 mM NAC for 48 h and probed in immunoblotting with antibodies designated on the left. Molecular weights are indicated on the right in kDa. pERK and ERK signals were quantified using ImageQuant software. pERK/ERK signal ratio was calculated and normalized to that of vector control (“Vec” lane). j NHMs infected with empty vector (Vec) or KLF9-expressing vector (KLF9) were treated or not with 0.5 mM NAC for 48 h and probed in immunoblotting with indicated antibodies. Molecular weights are indicated on the right in kDa. k Cells described in (j) were stained with H2DCFDA (DCF) followed by FACS analysis to determine intracellular ROS. 1 Cells described in (j) were cultured in media containing 0.5 mM NAC and were counted in triplicates on indicated days using to trypan blue exclusion assay starting 48 h after infection (*p <0.05; Student’s t-test). m, n ChIP assay. QPCR signals in reactions with DNA that was precipitated with NRF2, KLF9, or control IgG antibodies from NHMs expressing Vector or BRAFV600E. QPCR was performed with primers encompassing NRF2 binding site in KLF9 promoter (ARE1) (ARE2) or KLF9-binding site in TXNRD2 promoter. All QPCR signals were normalized by those obtained from IgG-precipitated DNA in Vector cells. Representative experiment shown (*n = 3, technical replicas, p <0.05; Student’s t-test). o NHMs expressing Vector or BRAFV600E were probed in QRT-PCR with primers corresponding to indicated genes. QRT-PCR signals were normalized by β-actin signal and by the corresponding signals in Vector cells. Representative experiment shown, (*n = 3, technical replicas, p <0.05; Student’s t-test). Each experiment was performed at least two times with consistent results