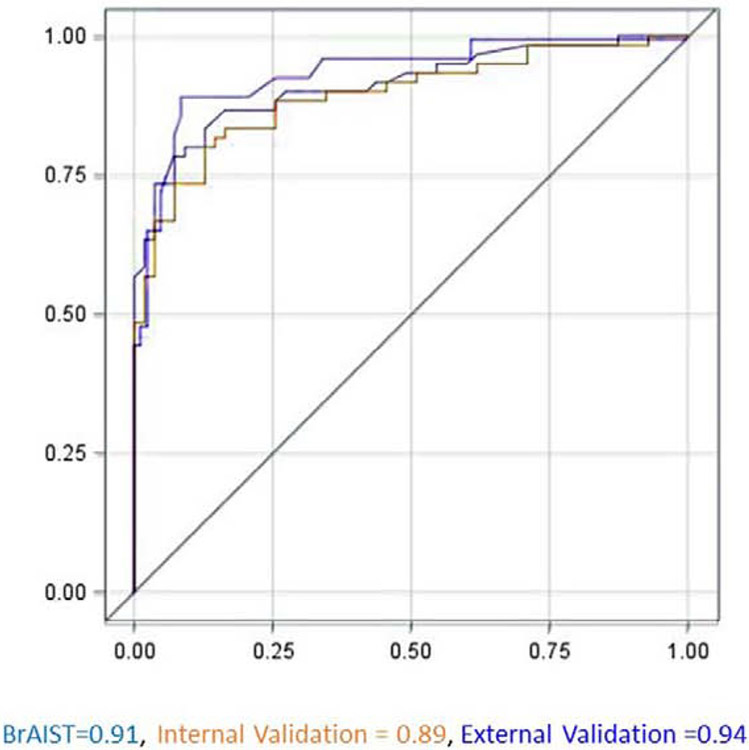
Figure 1.
Receiver operating characteristic (ROC) curves for identifying patients with a poor prognosis using the model. The c-statistic (area under the curve) and 95% confidence intervals were 0.91 (0.86, 0.97) in the model development (BrAIST) dataset, 0.89 (0.83, 0.95) in the internal and 0.90 (0.84, 0.95) in the external validation datasets. The reference line indicates no discrimination.

