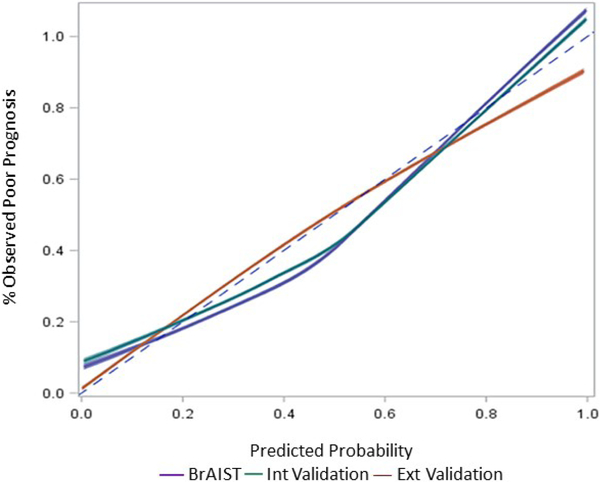
Figure 2.
Calibration plot for the Sanders model when applied to the development (BrAIST, blue line), internal (green line) and external validation (red line) samples. The distribution of predicted probabilities from each sample was divided into deciles and the average predicted probability per decile (x-axis) was plotted against the percentage of patients in each decile observed to have a poor prognosis (y-axis). Loess smoothing was used to generate the calibration lines. Perfect calibration is represented by the dotted line.

