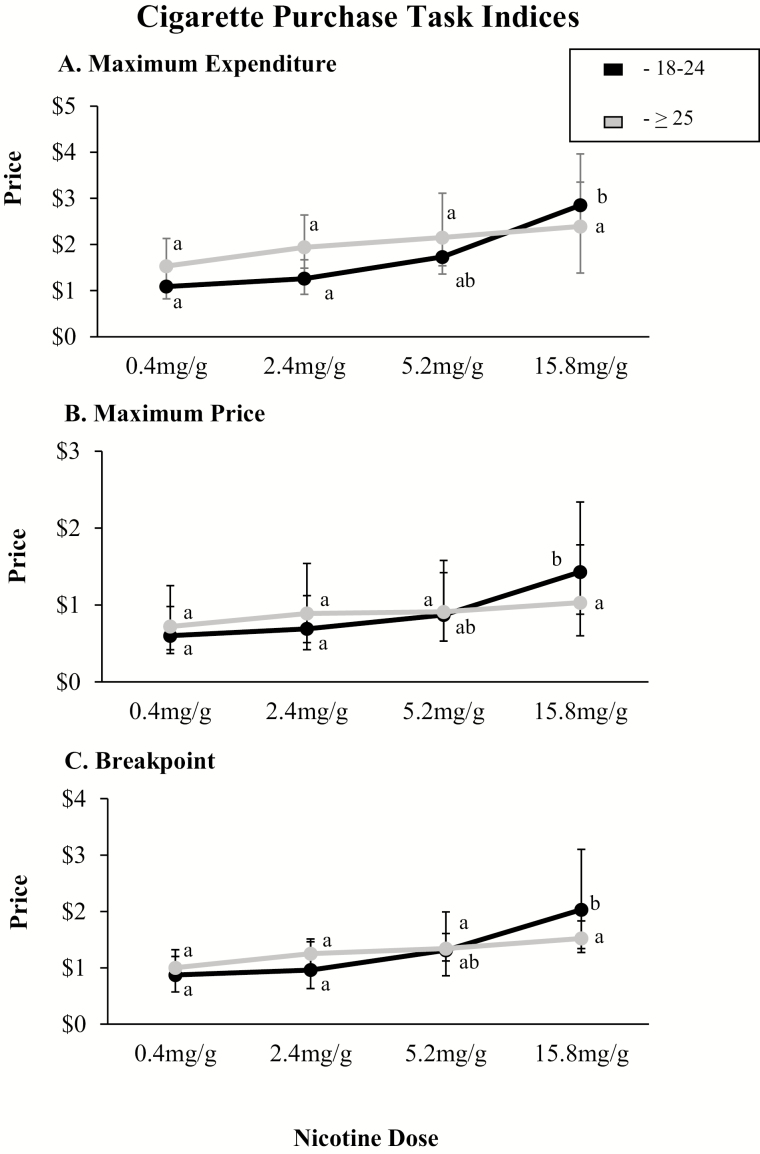
Figure 1.
Demand Indices from the Cigarette Purchase Task simulating demand for cigarette smoking at escalating price. Error bars represent 95% confidence intervals (CIs). Data points not sharing a letter differ significantly by dose within age group (p < .05). Panel A represents mean values by age group (18–24 vs. ≥ 25 years old) at each dose for maximum expenditure per cigarette. Panel B represents mean values by age group (18–24 vs. ≥ 25 years old) at each dose for price per cigarette at which smoking rate begins decreasing proportionate to increasing price (Maximum Price). Panel C represents mean values by age group (18–24 vs. ≥ 25 years old) at each dose for Breakpoint, or price per cigarette at which smoking rate decreases to 0. Analyses included session order, project, CPD, and FTND as covariates. FTND = Fagerström Test for Nicotine Dependence.

