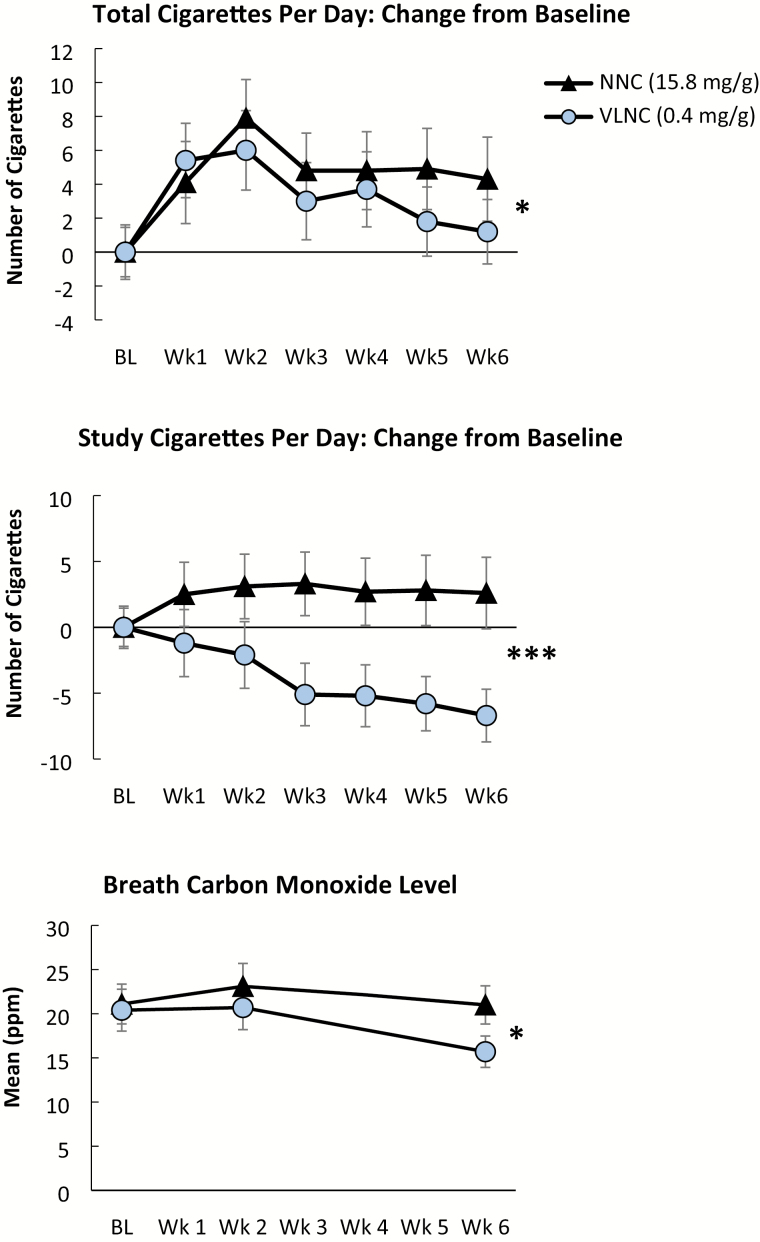
Figure 1.
Effects of the 0.4 mg/g (very low nicotine content) cigarette condition (circles) and the 15.8 mg/g (normal nicotine content) cigarette condition (triangles) on change from baseline in total number of cigarettes smoked per day (top), change in baseline in study cigarettes only (middle), and breath carbon monoxide (CO) levels across study weeks. Symbols represent M ± SEM. Significant main effects of cigarette type on week 6 outcomes are indicated with asterisks (*p < .05, ***p < .001).

