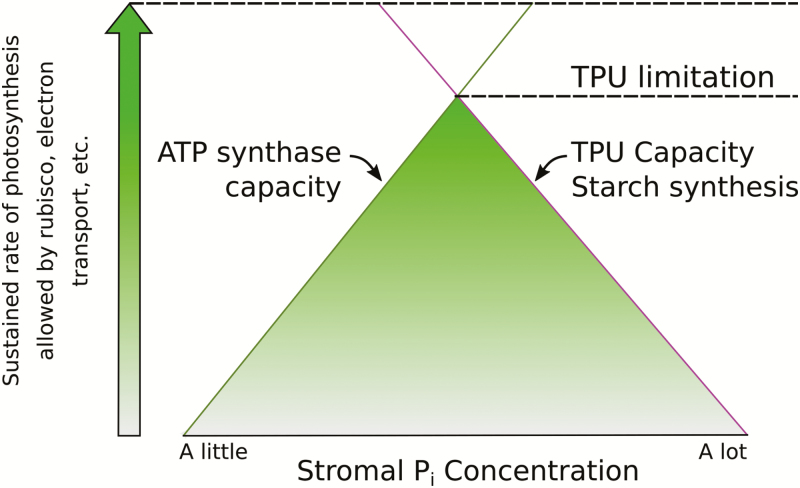
Fig. 3.
As the photosynthetic rate increases, the gap between the phosphate concentration required by the ATP synthase and the phosphate concentration to inhibit starch synthesis narrows. The shapes of the responses are represented by straight lines only for simplicity. When TPU limits the photosynthetic rate, any increase in phosphate required for higher ATP synthase activity would inhibit starch synthesis, restricting phosphate release.

