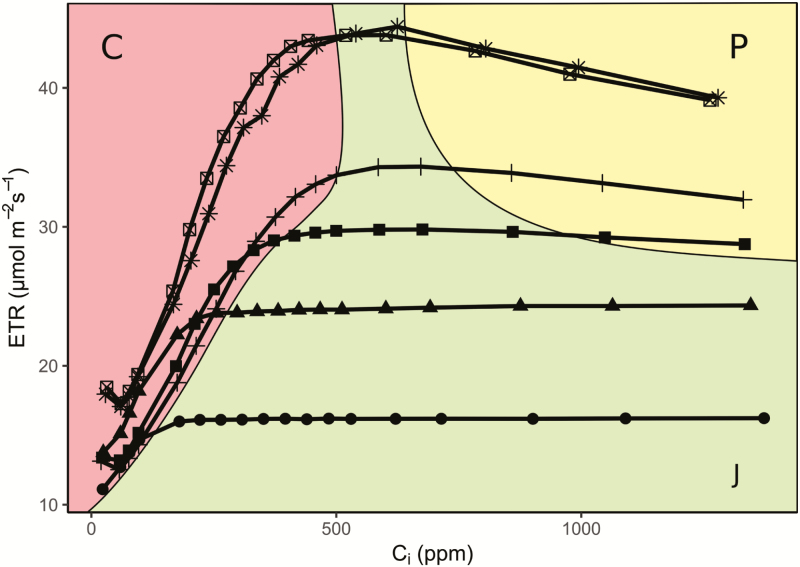
Fig. 4.
The decline in electron transport rate is diagnostic of TPU limitation. Combined gas exchange and fluorescence data in A/Ci curves of Nicotiana benthamiana at varying light intensity and 35 °C. At low CO2, plants are limited by Rubisco activity (C limitation, red), characterized by a sharp upwards slope of both A and ETR with increasing CO2. When light is insufficient, plants will be limited by the rate of RuBP regeneration (J limitation, green), characterized by a flat slope of the ETR with increasing CO2. Only when the plant has ample CO2 and electron transport will TPU limitation (P, yellow) be seen, characterized by a decline in ETR with increasing CO2. ETR is calculated from fluorescence-derived ΦPSII. Light intensity (µmol m−2 s−1):  , 250;
  , 400;
  , 550;
  , 750;
  , 1000;
  1500.
1500.

