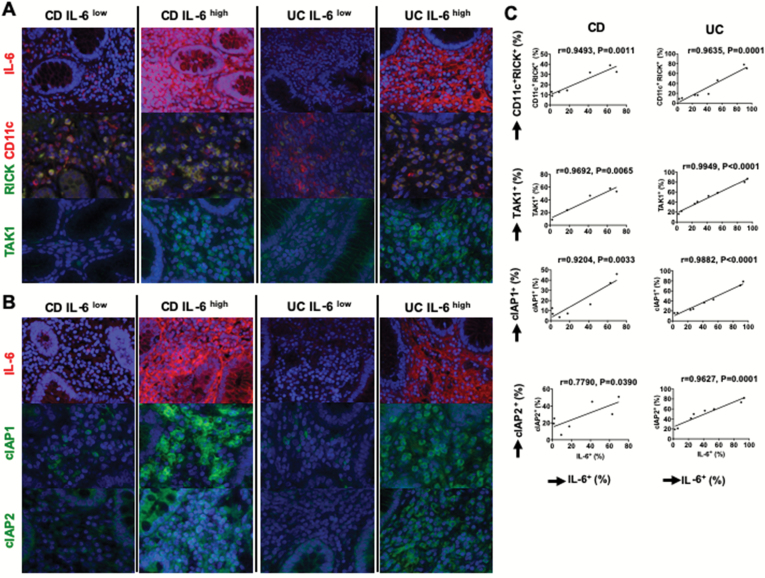
Fig. 6.
Expression of IL-6 is positively correlated to that of RICK, cIAP1, cIAP2 and TAK1 in patients with IBDs at a protein level. Expression of IL-6 and RICK-associated molecules was examined by immunofluorescence analysis using surgical specimens obtained from CD patients (n = 5 or 7) or UC patients (n = 8). (A) Representative immunofluorescence photomicrograph of patient tissue stained with anti-IL-6 antibody (red color), anti-RICK antibody (green color) and anti-CD11c antibody (red color), or anti-TAK1 antibody (green color); left panel of both CD and UC shows tissue expressing low numbers of IL-6+ (IL-6low) cells; right panel of both CD and UC shows tissue expressing high numbers of IL-6+ (IL-6high) cells. Nuclei were stained with DAPI, magnification ×1200 (RICK, CD11c, TAK1), ×800 (IL-6). (B) Representative immunofluorescence photomicrograph of patient tissue stained with anti-IL-6 antibody (red color), anti-cIAP1 antibody (green color) or anti-cIAP2 antibody (green color); left panel of both CD and UC shows tissue expressing low numbers of IL-6+ (IL-6low) cells; right panel of both CD and UC shows tissue expressing high numbers of IL-6+ (IL-6high) cells. Nuclei were stained with DAPI, magnification ×1200 (cIAP1, cIAP2), ×800 (IL-6). (C) The numbers of cells positive for IL-6, RICK, CD11c, cIAP1, cIAP2 and TAK1 was determined by counting in high-power fields and shown as the percentages of total DAPI-positive mononuclear cells. The percentages of cells positive for RICK, CD11c, cIAP1, cIAP2 and TAK1 were plotted against IL-6+ cells. Correlation analysis between cell populations shown was performed; each dot corresponds to a value of each patient sample. P value and Pearson r values are shown.

