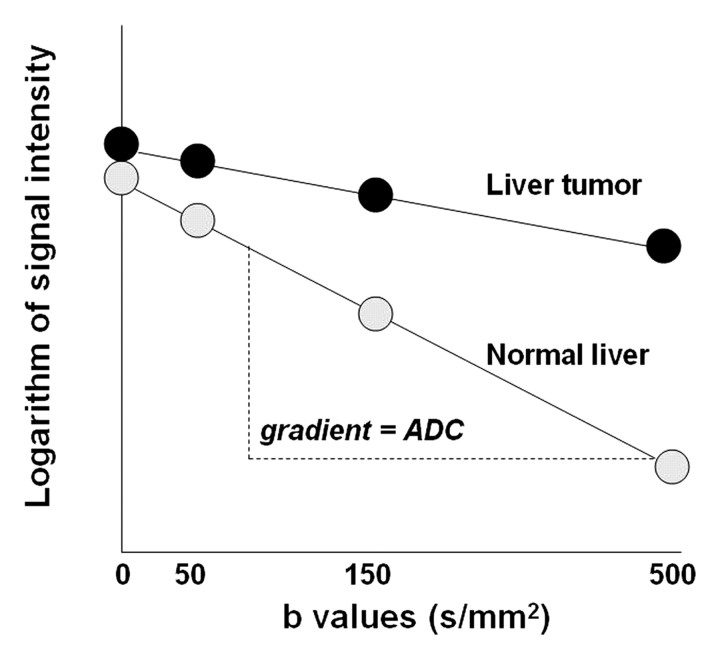
Figure 5b.
(a) Graph illustrates signal intensity versus b values at diffusion-weighted imaging (DWI) of tissue with normal versus restricted diffusion. (b) Graph illustrates the logarithm of signal intensity versus b values at diffusion-weighted imaging of normal liver versus liver tumor. The signal of water molecules decays exponentially with increasing b values for different tissue types. The decay in signal is reduced in tissues with restricted diffusion (eg, tumor). The ADC represents the slope (gradient) of the plotted lines. The greater the number of b values used in the analysis, the more accurate the ADC calculation.

