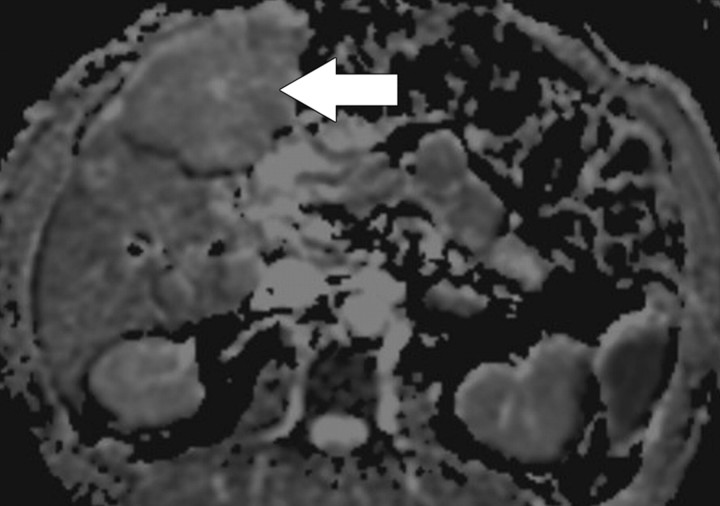
Figure 7d.
Hemangioma. (a) Gadolinium-enhanced gradient-echo T1-weighted MR image shows a hemangioma with peripheral nodular enhancement (arrow). (b) On a fast spin-echo T2-weighted MR image, the hemangioma (arrow) is lobulated and demonstrates very high signal intensity. (c) On a diffusion-weighted image (b = 500 sec/mm2), the hemangioma (arrow) demonstrates high signal intensity due to slow-flowing blood. (d) ADC map shows the diffusion of the hemangioma (arrow) to be similar to that of background liver (ie, unimpeded).

