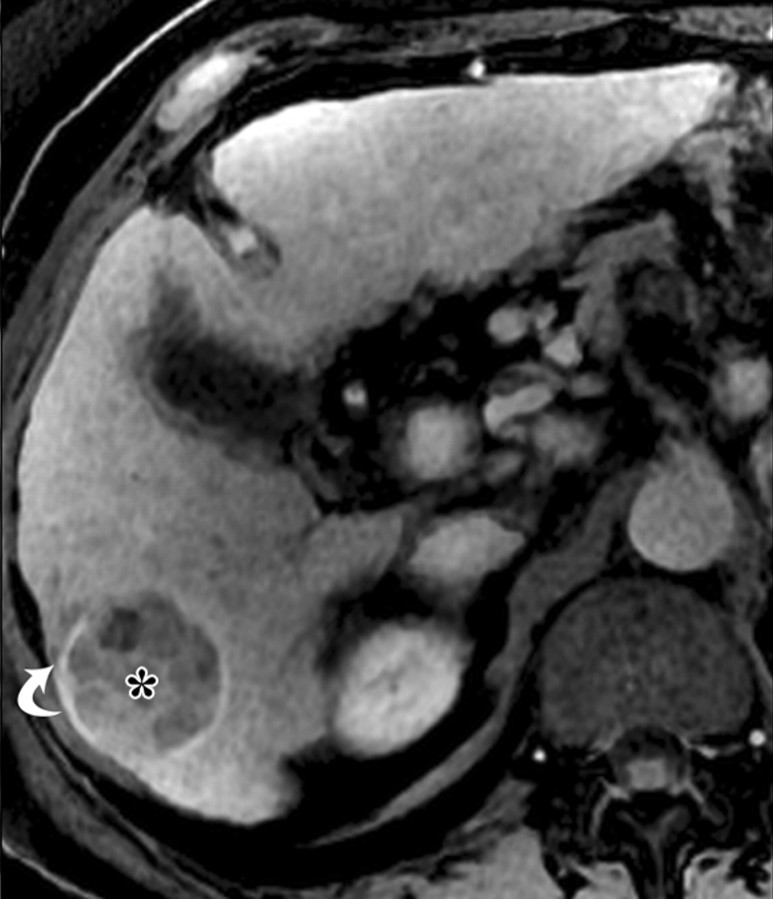
Figure 10b.
Dynamic enhancement patterns of fibrous versus neoplastic tissue after administration of a hepatobiliary gadolinium-based contrast agent. Axial 3D T1-weighted gradient-echo images (~4/1.5, flip angle = 15°), obtained at 3 T 20 seconds (a), 5 minutes (b), and 30 minutes (c) after intravenous injection of the hepatobiliary gadolinium-based contrast agent gadoxetate disodium, show a cirrhotic liver. Fibrotic scars are not well demonstrated in the arterial or late venous phase but are clearly visible as a meshwork of hypointense reticulations on the hepatocellular phase image (arrows in c). By comparison, a 4.2 × 4.1-cm HCC (*) in segment 6 enhances vividly in the arterial phase, washes out to hypointensity relative to the liver in the late venous phase, and remains hypointense to the liver in the hepatocellular phase. The tumor is surrounded by a fibrous capsule (arrow in a and b) and contains internal septa. Note the biliary excretion of contrast material on the 30-minute image.

