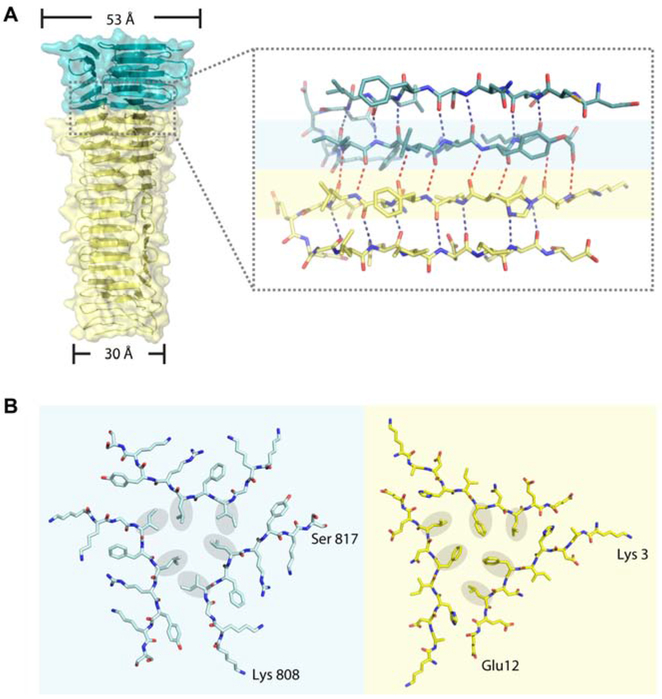
Figure 5. Binding interface analysis of PdpA and VgrG.
(A) Side view of the spike showing detailed interactions between PdpA (teal) and VgrG (yellow). In the inset, oxygen and nitrogen atoms are colored red and blue, respectively; intra- and inter-molecular hydrogen bonds are shown by blue and red dotted lines, respectively.
(B) Stick representation of the bottom strands of the PdpA trimer (left, corresponding to residues on blue background in Figure 4A) and the top strands of the VgrG trimer (right, corresponding to residues on yellow background in Figure 4A) at their boundary. The hydrophobic residues are marked with grey oval background to show the “hydrophobic triangles”. The interfaces among both the PdpA strands and the VgrG strands are characterized by a mixture of hydrophobic interactions and hydrogen bonds.

