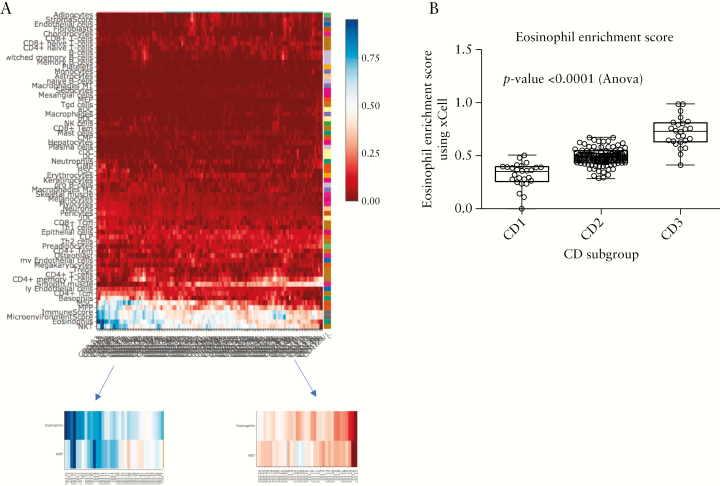
Figure 6.
Cell-type-specific signatures associated with the three subgroups. [A] Heat map showing the enrichment of different cell types in expression data from the uninvolved ileal tissue samples in the SB139 cohort obtained using the xCell23 tool. The left and right figure insets zoom in on the differential enrichment of eosinophil and NKT cells within the different samples. Higher enrichment scores were noticed in most of the samples belonging to the CD3 subgroup. [B] Statistical analysis of the eosinophil enrichment scores from xCell [ANOVA, p < 0.0001] indicated significantly higher scores in the CD3 subgroup and that CD1 had the lowest score. A similar trend was observed in NKT cells [supplementary Figure S5].

