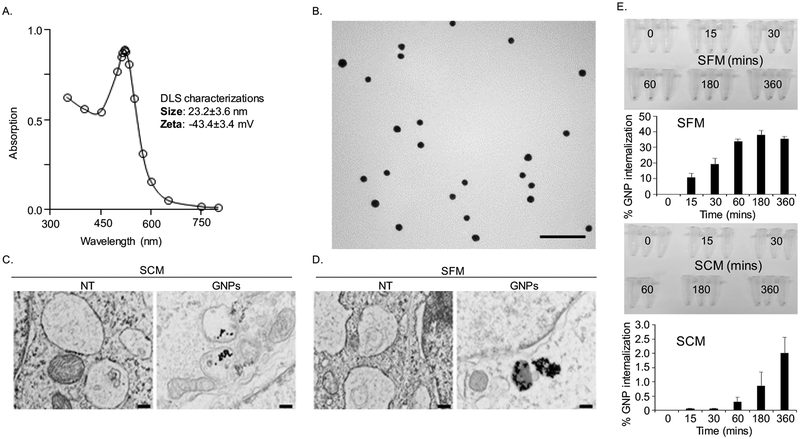
Figure 1.
GNPs characterizations and its cellular uptake. (A) The UV-Visible spectrum of as synthesized GNPs exhibits SPR band around 522 nm. (B) TEM micrographs of as synthesized GNPs showing spherical particles of ~ 20 nm diameter was formed by this method. Scale bar 100 nm. (C-D) Observation of internalized GNPs into CAFs through TEM. Treatment of CAFs with GNPs (20 μg/ml) was performed with or without the presence of serum for 4h. Cells without GNP treatment were used as controls (NT). Cells were then trypsinized, fixed, sectioned and then visualized under TEM. Scale bar 200 nm. (E) Quantification of internalized GNPs into CAFs via instrumental neutron activation analysis (INAA). CAFs were treated with GNPs at various time points, including 15, 30, 60, 180 and 360 mins in the presence or absence of serum and were then collected the cell pelletes by centrifugation with a brief tripsinization. The cells pelletes were captured with a digital camara and were then quantified by INAA.

