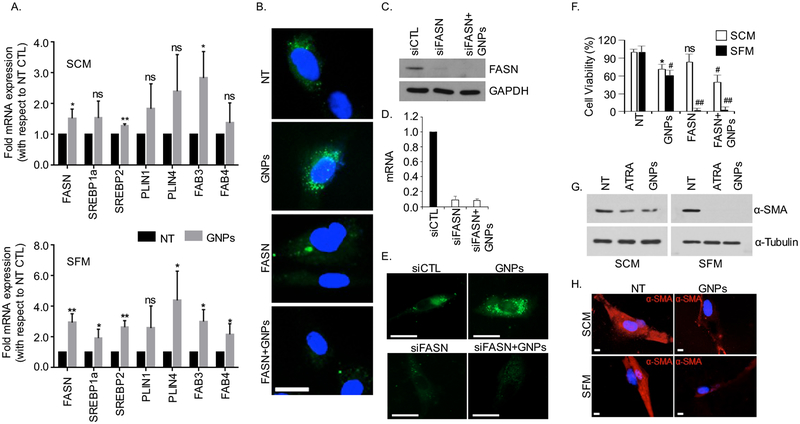
Figure 3.
GNPs treatment increased lipogenic gene expression and induced quiescence in CAFs. (A) GNPs upregulate the mRNA levels of lipid metabolism genes in CAFs analyzed by qRT-PCR. CAFs (2×10⁵ cells/10 cm dish) were cultured and were then treated with GNPs for 48 h in SCM and SFM condition separately. mRNA levels of important lipid metabolism genes (FASN, SREBP1a, SREBP2, PLIN1, PLIN4, FABP3 and FABP4) were determined using qRT-PCR, where 18s was used as internal control. Results were expressed as fold mRNA expression, with respect to non-treated controls (NT) and represented as mean±s.d. of three individual experiments (n=3). Statistical analyses were performed using student’s unpaired t-test (NT vs GNPs, ns = non-significant, *p<0.05, and **p<0.01). (B). Inhibition of fatty acid synthatase (FASN) by C75 reduced lipid droplets formation. CAFs were pretreated with C75 at a dose of 50 μM for 2h in the presence of SCM and followed by treatment with GNPs for 48h. The cells were stained with BODIPY (green, λex./em.=493/503 nm), fixed and were visualized under microscope after mounting with DAPI (blue, λex./em.=340/380 nm). Scale bar 20 μm. (C-E) Knock-down of FASN by siRNA reduced the lipid droplets formation. CAFs were transfected with FASN siRNA at a dose of 133 nM. Post 48h, the mRNA and protein expression were determined by RT-qPCR and immunoblotting, where 18s and GAPDH were used controls respectively. Neutral lipids into control and knock-down cells were also visualized by staining BODIPY (green, λex./em.=493/503 nm) under microscope. Scale bar 20 μm (F) CAFs were pretreated with C75 at a dose of 50 μM either in SCM or SFM, post 48h, cells were counted by using hemocytometer. Results were expressed as the viable cells (%) with respect to NT from three individual experiments (n=3) and statistical analyses were performed using one way anova, followed by multiple comparison test (NT vs treated, mean±s.d., ns=non-significant, *p<0.05, #p<0.001 and ##p<0.0001). (G) Western blot for α-smooth muscle actin (α-SMA) showing decreased expression of α-SMA upon 48h GNPs and ATRA treatment, where GAPDH was used as the loading control. (H) Immunofluorescence for α-SMA showing reduced fluorescence (red) upon GNP treatment. Scale bar 5 μm.

