Figure 7.
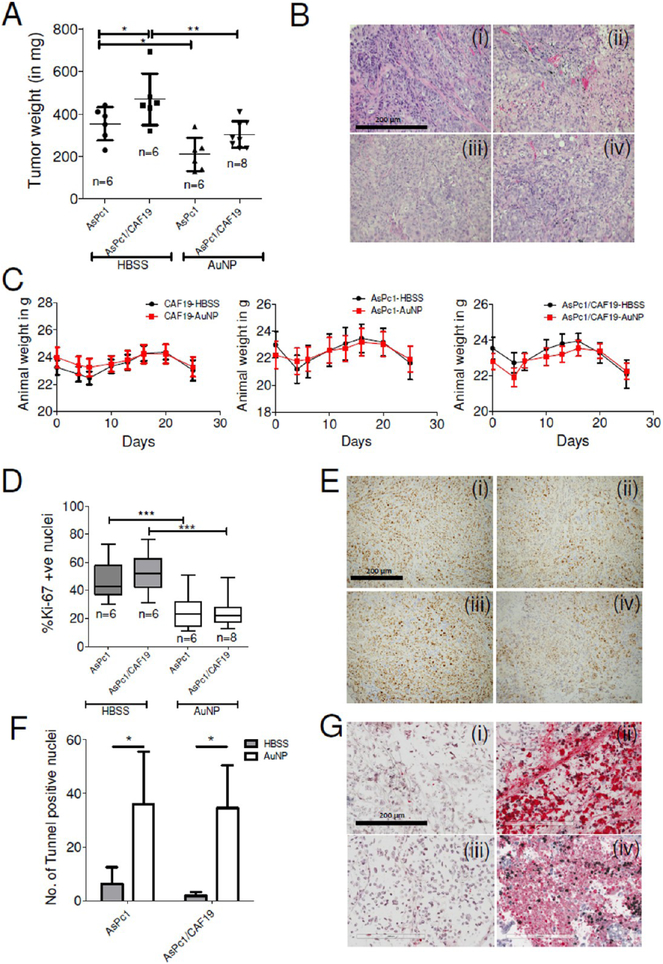
Inhibition of tumor growth in orthotopic models of pancreatic cancer by AuNP. (A) Scattered plot of tumor weight in HBSS-treated (sham) or 100 μg/daily i.p. Twenty nm AuNP-treated animals post 21 days of treatment. Statistical analysis was performed using One-way ANOVA followed by Newman–Keuls multiple comparison test. (B) Representative H&E stained sections of (i) AsPc1-HBSS, (ii) AsPc1-AuNP, (iii) AsPc1/CAF19-HBSS, and (iv) AsPc1/CAF19-AuNP groups. Statistical analysis was performed using One-way ANOVA followed by Newman–Keuls multiple comparison test. (C) Animal body weight changes over time in CAF19 only, AsPc1 only, and AsPc1+CAF19 cells injected animals receiving HBSS or AuNP daily demonstrating apparent nontoxic behavior of AuNPs. (D) Whiskers min-to-max plot of Ki-67 stained nuclei in HBSS or AuNP-treated AsPc1 or AsPc1/CAF19 tumors. (E) Representative Ki-67 stained sections of tumors from (i) AsPc1-HBSS, (ii) AsPc1-AuNP, (iii) AsPc1/CAF19-HBSS, and (iv) AsPc1/CAF19-AuNP groups. Images were acquired using 4× objective and quantified using ImageJ (NIH). (F) Histograms representing number of tunnel stained nuclei in HBSS or AuNP-treated AsPc1 only or AsPc1/CAF19 tumors. (G) Representative tunnel stained sections of tumors from (i) AsPc1-HBSS, (ii) AsPc1-AuNP, (iii) AsPc1/CAF19-HBSS, and (iv) AsPc1/CAF19-AuNP groups. Images were acquired using 4× objective and quantified using ImageJ (NIH). Statistical analysis was performed using One-way ANOVA followed by Newman–Keuls multiple comparison test. *p ≤ 0.05, **p ≤ 0.01, ***p ≤ 0.001.

