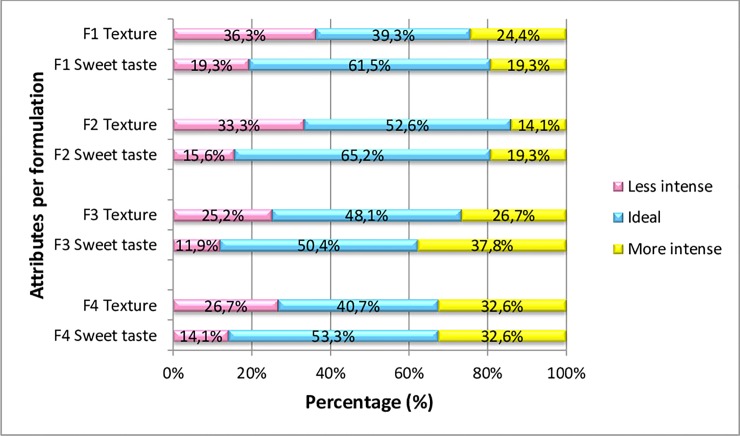
Fig 4. Frequencies of intensity ratings (1 = "less intense than I like", 2 = "ideal, the way I like it", and 3 = "more intense than I like") for the sweet taste attribute and (1 = “less soft than I like”, 2 = “ideal, the way I like it”, 3 = “softer than I like”) for the attribute texture.
Measured on a 3—point JAR Scale for different cakes formulations (F1–0% MSF and 100% wheat flour, F2–10% MSF and 90% wheat flour, F3–30% MSF and 70% wheat flour, and F4–50% MSF and 50% wheat flour).

