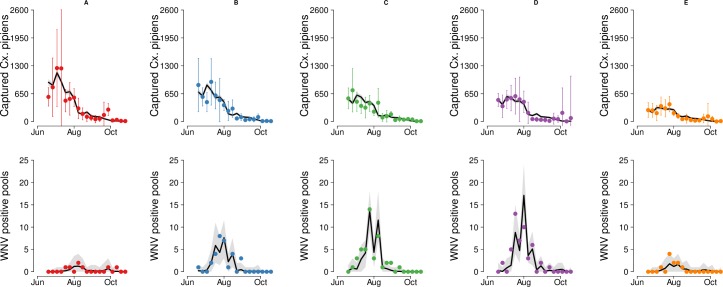
Fig 3. Models fit for 2018.
Fit of the entomological (first row) and epidemiological (second row) models to the observed average number of captured Cx. pipiens mosquitoes and total number of WNV positive pools in 2018 by cluster (A: first column, B: second column, C: third column, D: fourth column, E: last column). Solid line: average. Shaded area: 95%CI of model predictions. Dots: observed data. Bars: 95%CI for the average of the observed captures.

