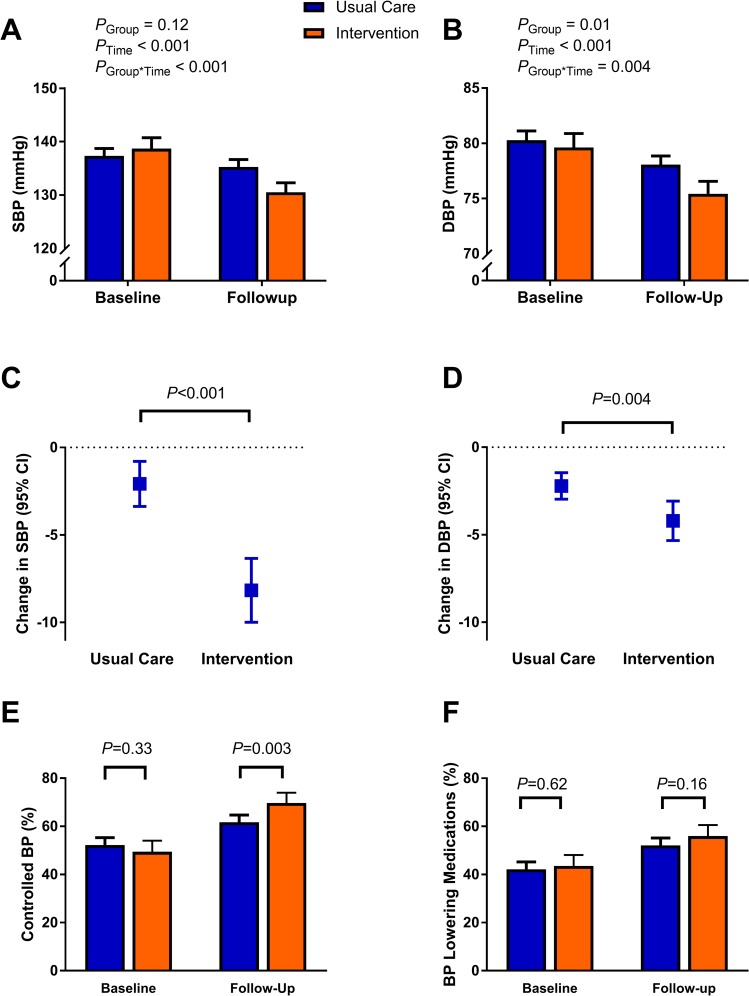
Fig 3. Summary of study findings.
SBP (A) and DBP (B) at baseline and follow-up according to study group. Change in SBP (C) and DBP (D) in the usual care and intervention groups. Proportion of patients with controlled BP (E) and taking BP-lowering medications (F) at baseline and follow-up according to study group. P values for categorical variables were generated using a test for 2-sample differences in proportions (E and F), while differences in continuous variables were generated using linear regression (A–D). Error bars show 95% confidence limits. BP, blood pressure; DBP, diastolic blood pressure; SBP, systolic blood pressure.

