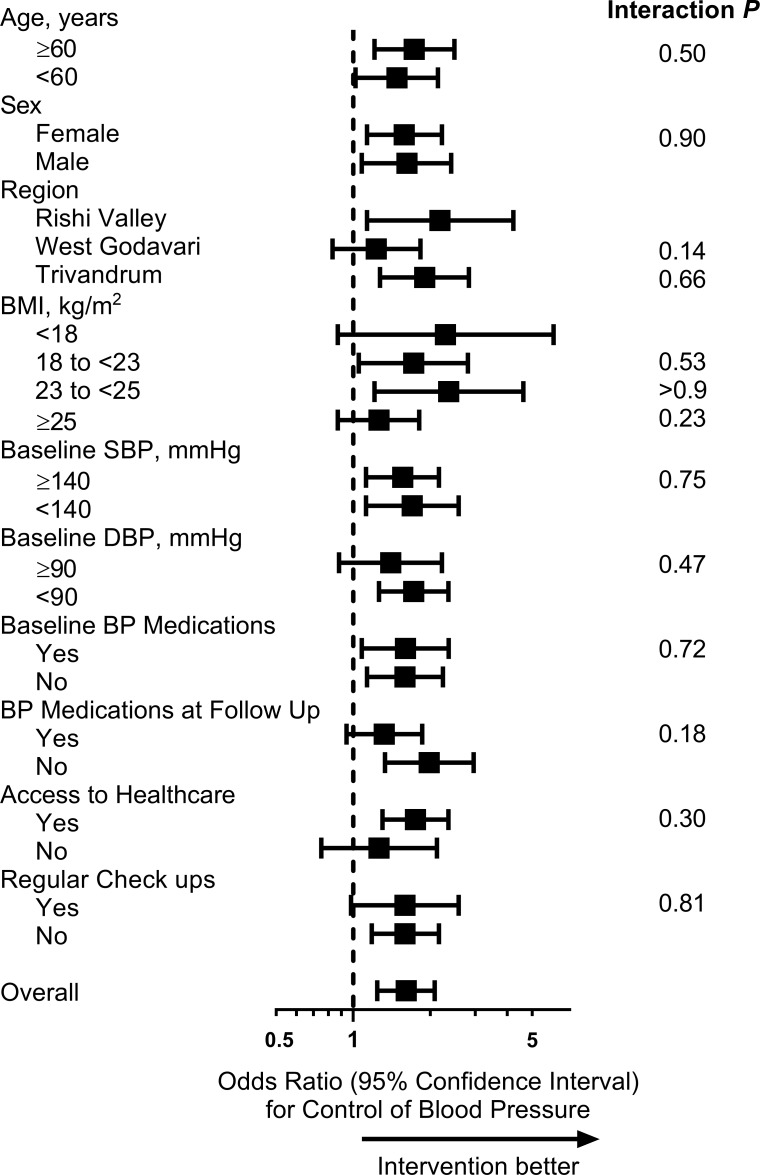
Fig 4. Forest plot of differences in control of BP by group, according to different characteristics of the sample (complete case analysis).
The dashed line represents the line of no effect. Symbols show point estimates, and error bars show 95% confidence limits. P values indicate subgroup interactions (obtained using logistic regression). The following variables had missing data: BMI, 7; access to healthcare, 9; and regular check-ups, 7. BMI, body mass index; BP, blood pressure; DBP, diastolic blood pressure; SBP, systolic blood pressure.

