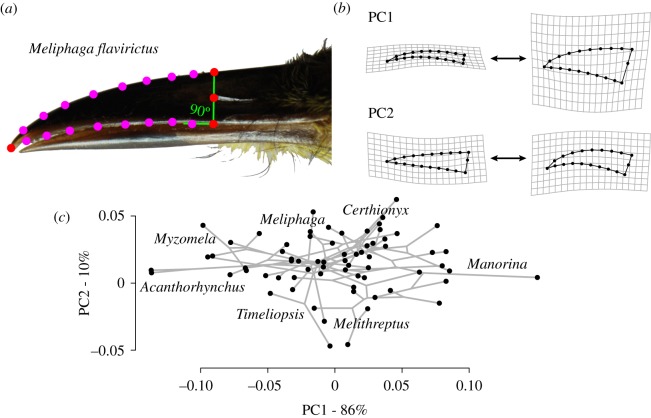
Figure 1.
(a) Yellow-gaped honeyeater specimen illustrating positions of landmarks (red) and semi-landmarks (magenta). Semi-landmarks were spaced at equal intervals between landmarks using TPSdig. (b) Relative warp grids showing the extreme values of the first two principal component axes (PC1 and PC2). PC1 is referred to as ‘depth’, and PC2 is referred to as ‘curvature’ throughout. (c) Phylomorphospace of honeyeater beaks, using the first two PC axes, which together account for 95% of shape variation. Genera with divergent phenotypes are noted.

