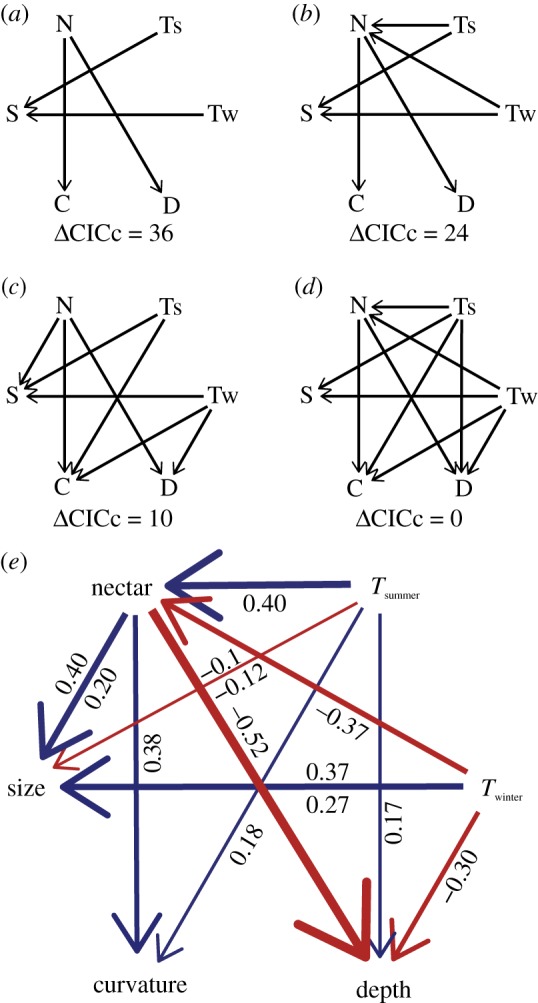
Figure 2.

Phylogenetically corrected path analysis models. On the top versus bottom are models describing hypotheses in which axes of beak variation are split into different functions (a,b) or shared among functions (c,d). Predictors described in (e) are listed as abbreviations in models shown above. Here, we describe beak shape PC1 as ‘depth’ and PC2 as ‘curvature’ to reflect the positive direction of each axis. On the left and right are models describing hypotheses where functions exclude interfering indirect effects (a,c) or include them (b,d). Model fit is assessed by the C-statistic information criterion (CICc) following [62]. The best fitting model is shown in (e), with red arrows indicating negative associations and blue arrows indicating positive ones; values shown below each arrow refer to correlation coefficients; values estimated for body size residuals of beak size are shown above arrows.
