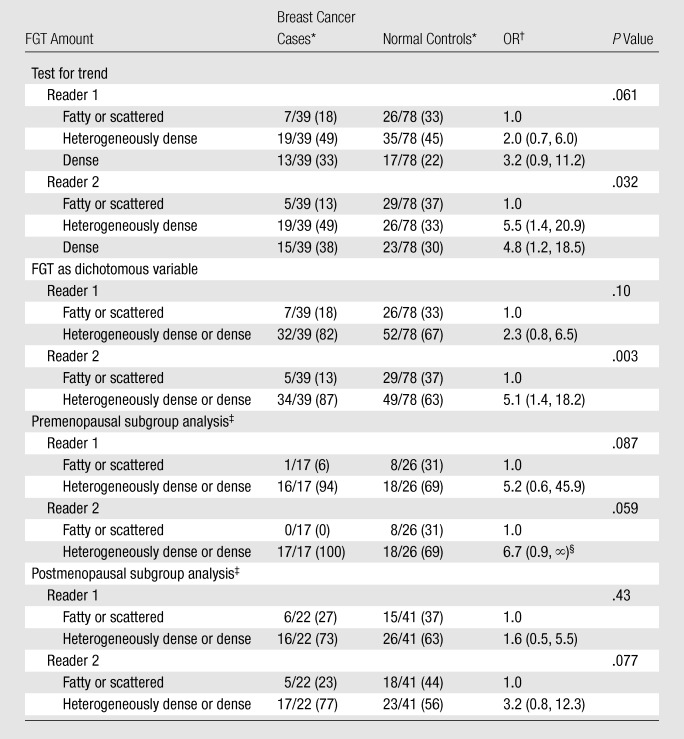
Table 4.
ORs of Breast Cancer according to FGT Amount: Breast Cancer Cases vs Normal Controls

Numbers in parentheses are percentages.
Numbers in parentheses are 95% CIs.
Data were adjusted for menopausal status when pre- and postmenopausal women were included in the analysis. These analyses also were performed with FGT as a dichotomous variable.
Median unbiased estimate.
