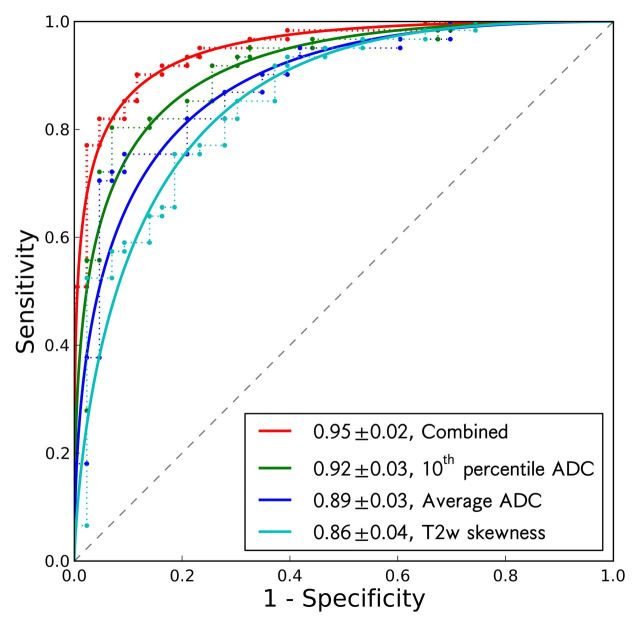
Figure 2:
ROC curves of 10th percentile ADC, average ADC, T2-weighted skewness, and combination of the three image features in the differentiation of prostate cancer foci and normal PZ tissue. Solid lines are maximum likelihood estimates of proper binormal ROC curves, and dashed lines are observed data. AUCs and standard errors are listed in the legend.

