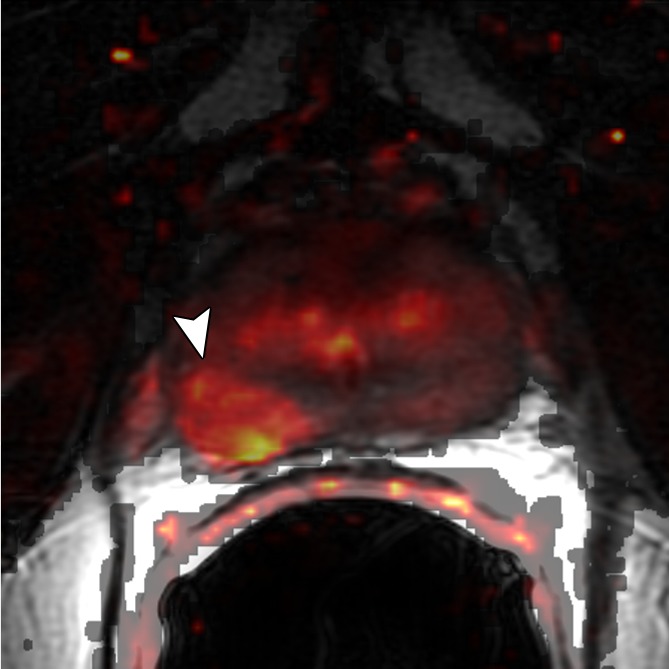
Figure 3d:

Images obtained in a 69-year-old patient with biopsy-proved PCa (Gleason score, 3 + 4) in the right midgland. (a) Neither reader saw the cancer on the T2-weighted image. On the (b) parametric map of Ktrans, (c) ADC map (b = 0 and 1000 sec/mm2), and (d) fused presentation of a and b, both readers clearly identified the tumor (arrowheads). Note the hypointense peripheral zone on a caused by postradiation changes.
