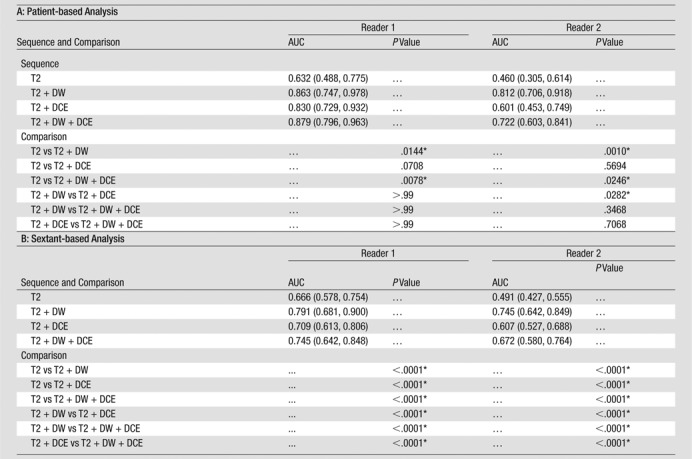
Table 2.
ROC Analysis

Note.— Data in parentheses are 95% confidence intervals. AUCs were estimated and compared on the patient level by using the methods of DeLong et al (24) and on the sextant level by using the methods of Obuchowski (25).
Difference is significant.
