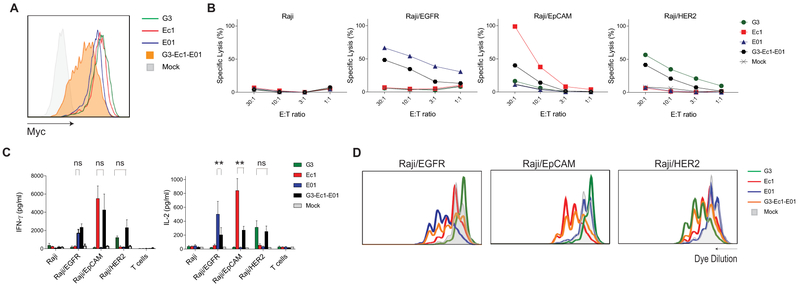
FIGURE 3:
Trispecific CAR function against target cells expressing single antigens. (A) Surface expression of monospecific and trispecific DARPins CARs measured by staining of N-terminal MYC tag. (B,C) Cytotoxicity and cytokine production of monospecific versus trispecific DARPin specific cells against Raji cells expressing EGFR or EpCAM or HER2 (n=3). (D) Proliferation of the trispecific G3-Ec1-E01 specific cells against Raji cells expressing single targets. (**-p<0.05, ns-not significant).

