. 2019 Dec 13;8:e50616. doi: 10.7554/eLife.50616

Figure 2. SCLC cells with protrusions migrate in a saltatory fashion similar to neuroblasts.

(A) Representative immunofluorescence images of N2N1G mSCLC cells expressing membrane-GFP (GFP, green) and stained (red) for expression of the neuronal marker Tuj1, the axonal marker TAU, or the dentritic marker MAP2. DAPI marks the nucleus of cells in blue. Scale bars, 50 μm. (B) Quantification of (A) for two mouse SCLC cell lines (16T, N2N1G) and one human SCLC cell line (NCI-H446). Images for 16T and NCI-H446 are shown in Figure 2—figure supplement 1B–C. N = 5/cell line. The bar is the mean. (C) Quantification of the length of protrusions in three mSCLC cell lines (KP22, no visible protrusions, 16T and N2N1G with protrusions). The average cell size in these experiments was ~8 μm. Each dot represents a cell. N > 10 fields were quantified in one biological replicate. Mean + /- s.d. is shown, Mann-Whitney test. (D) Representative still images from time-lapse videomicroscopy analysis of 16T SCLC cells showing the dynamic nature of the protrusions (from Video 1). (E) Quantification of the saltatory movements of three mSCLC cell lines as indicated. Note the correlation between the presence of protrusions and the ability of making longer steps (longer than the average cell size). Each dot represents a cell. N > 10 fields were quantified in one biological replicate. Mean + /- s.d. is shown, Mann-Whitney test. (F–H) Example of single cell movement over time for each of the three mSCLC cell lines.

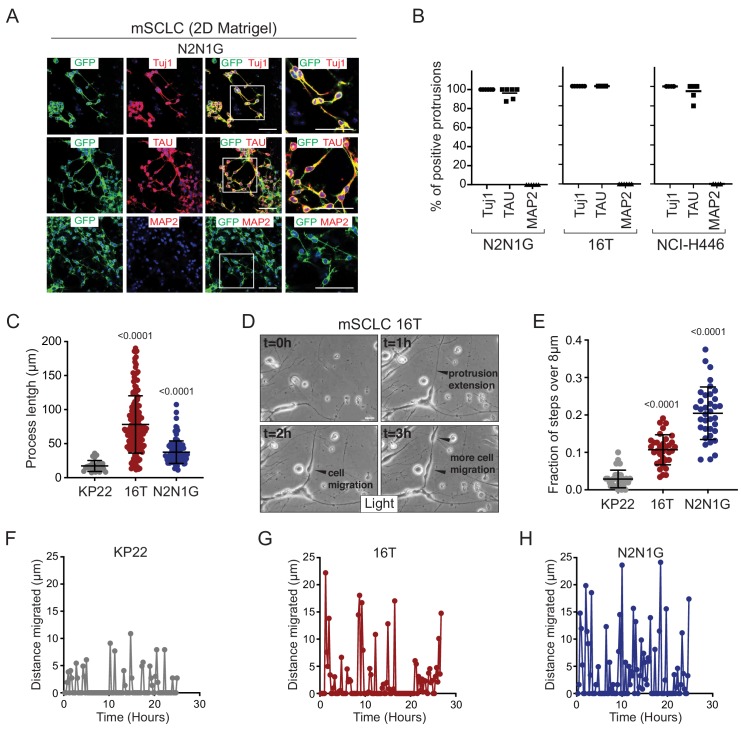
Figure 2.

Figure 2—figure supplement 1. SCLC protrusions resemble axons and enable rapid cell movement.

Figure 2—figure supplement 1.

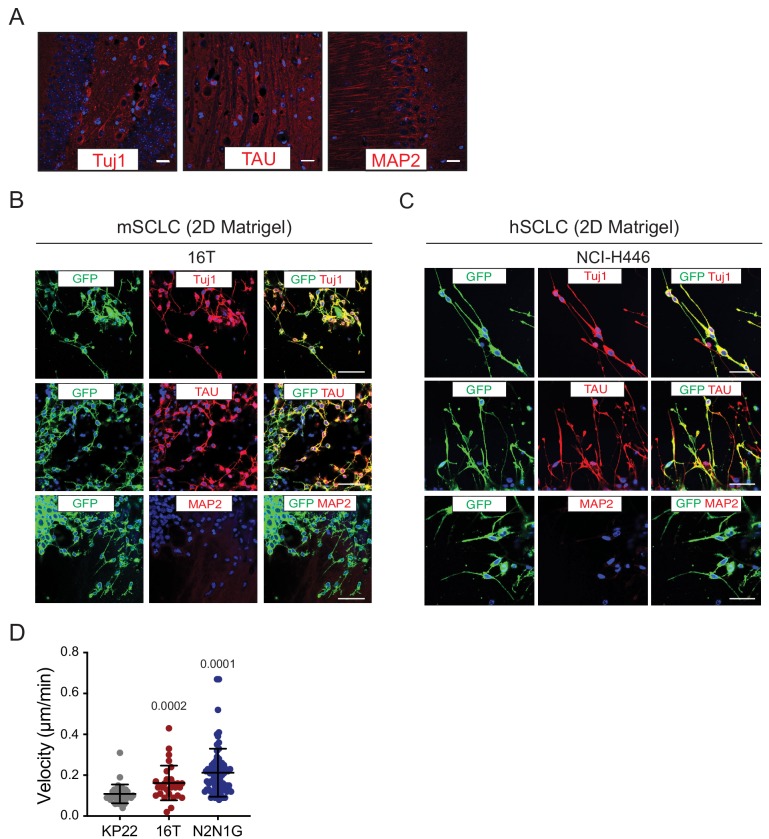
(A) Representative fluorescence images of a mouse brain section stained with Tuj1, TAU, and MAP2 antibodies (positive controls, red). DAPI marks the nuclei of cells in blue. Scale bars, 50 μm. (B–C) Representative fluorescence images of 16T mSCLC cells (B) and NCI-H446 hSCLC cells (C) expressing membrane-GFP (mGFP) and stained (red) for expression of the neuronal marker Tuj1, the axonal marker TAU, or the dentritic marker MAP2. DAPI marks the nucleus of cells in blue. Quantification is shown in Figure 2B. Scale bars, 50 μm. (D) Quantification of velocity of mSCLC cancer cells from the three mouse SCLC cell lines indicated. Each dot represents a cell. Mean + /- s.d. is shown, Mann-Whitney test.
Figure 2—figure supplement 2. Mouse and human SCLC cells express axonal markers in vivo.

Figure 2—figure supplement 2.

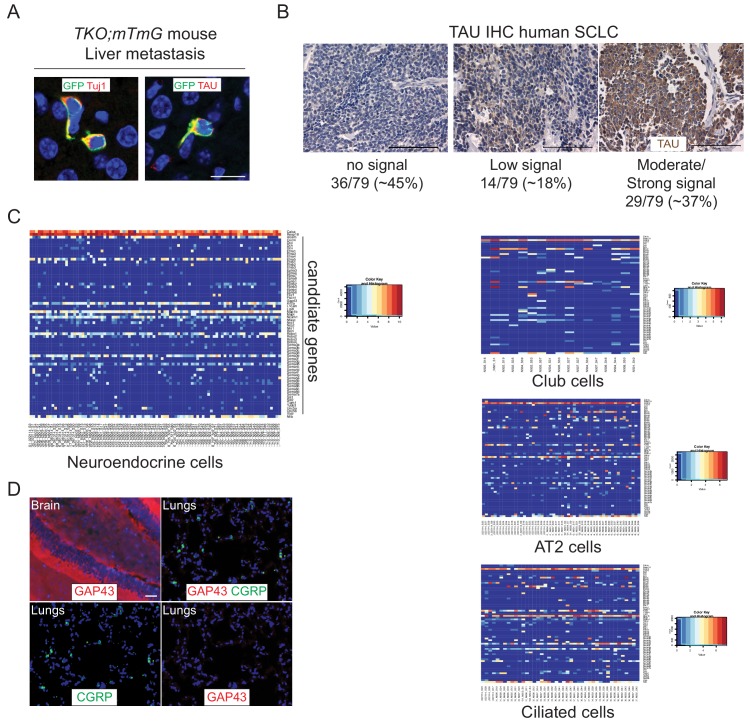
(A) Representative immunofluorescence staining of SCLC cells in the liver of a TKO;mTmG mouse (in which SCLC cancer cells express membrane GFP (GFP)). These cancer cells have protrusions positive for TAU and Tuj1. Images represent a merge of the GFP signal (green) and the signal for the TAU or Tuj1 antibodies (red). The nucleus of cells is labeled in blue by DAPI. Scale bar, 20 μm. (B) Representative images of immunohistochemistry (IHC) for TAU (brown) on human SCLC tissue microarrays (N = 79 human samples analyzed). The signal was evaluated by a certified pathologist (K.C.). Scale bars, 100 μm. (C) Gene expression analysis of the 69-gene list signature in single cells from the adult lung. Data are log2(tpm) from Ouadah et al. (2019). Nfib was added to the list of genes. Calca and Resp18 are shown as positive controls for neuroendocrine cells (top rows). Note that the gene signature with the 69 candidate genes is not globally activated in any of these lung epithelial cell types. (D) Representative immunofluorescence images for GAP43 (red) on sections of adult brain or adult lungs. CGRP-positive neuroendocrine cells can be detected in the lungs but these cells are not GAP43-positive (GAP43 is not detected in other lung epithelial cells either). DAPI marks the nucleus of cells in blue in all the sections. Scale bar, 20 µm.