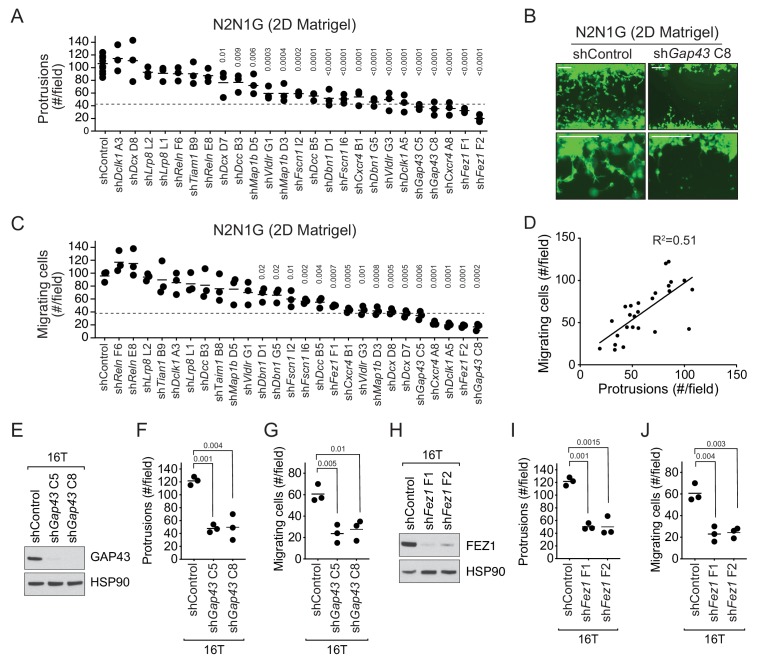
Figure 3. The axonal-like protrusions contribute to the migratory ability of SCLC cells in culture.
(A) Quantification of the number of cells with protrusions when mGFP-labeled N2N1G mSCLC cells were allowed to grow into a cell-free scratch generated in monolayer cultures under Matrigel. N = 3 independent experiments (shControl, N = 3 per experiment, total N = 9 plotted together). An unpaired t-test was used for statistical analysis and p-values are shown. Only significant p-values are shown. The dotted line represents a 60% reduction compared to the mean value of the controls. (B) Representative images of the data quantified in (A) and (C) with knock-down of Gap43. Scale bars, 100 μm. (C) Quantification of the migration of cells with protrusions when mGFP-labeled N2N1G mSCLC cells were allowed to grow into a cell-free scratch generated in monolayer cultures under Matrigel. N = 3 independent experiments. An unpaired t-test was used for statistical analysis and p-values are shown. Only significant p-values are shown. The dotted line represents a 60% reduction compared to the mean value of the controls. (D) Correlation of the data in (A) and (C) using the mean value for each knock-down. Pearson correlation R2 value is shown. (E and H) Immunoblot analysis of GAP43 or FEZ1 levels, respectively, in control and knock-down 16T mSCLC cells. HSP90 is a loading control. (F and I) Quantification of the number of cells with protrusions as in (A) with 16T mSCLC cells and Gap43 or Fez1 knock-down, respectively (N = 3). An unpaired t-test was used for statistical analysis and p-values are shown. (G and J) Quantification of the migration of cells with protrusions as in (B) with 16T mSCLC cells and Gap43 or Fez1 knock-down, respectively (N = 3). An unpaired t-test was used for statistical analysis and p-values are shown.


