. 2019 Dec 13;8:e50616. doi: 10.7554/eLife.50616

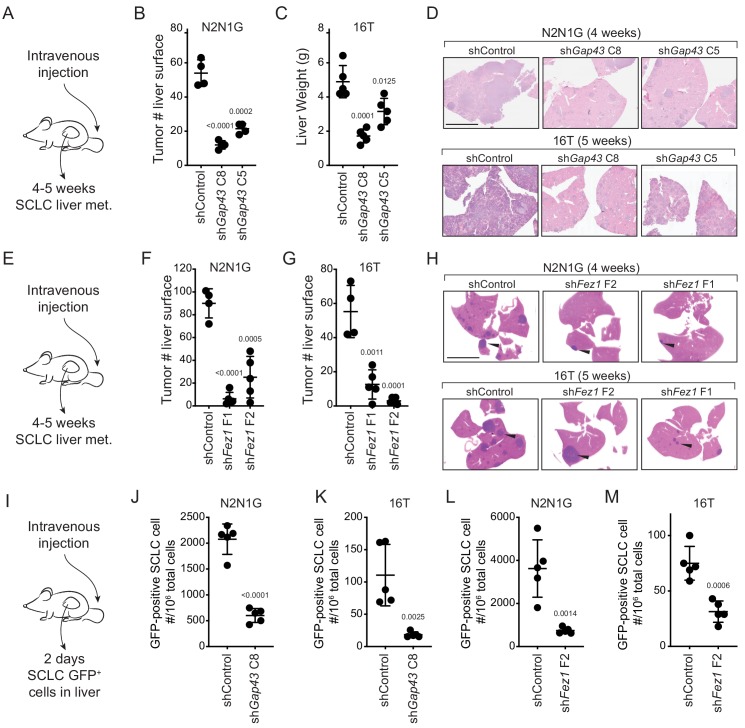
Figure 4. Genes involved in the generation of protrusions also control the formation of metastases.

(A) Diagram of the approach to investigate the formation of liver metastases (met.) after intravenous injection of SCLC cells. (B–C) Quantification of the number of metastases 4 and 5 weeks after intravenous injection of N2N1G and 16T mSCLC cells, respectively, with control knock-down or knock-down of Gap43 with two independent shRNAs. For N2N1G, tumors at the surface of the liver were quantified on the liver surface, as shown in Figure 4—figure supplement 2D. Too many tumors were present with the 16 T cell line and the control shRNA, and quantification was thus performed by measuring liver weight. N = 4–5 mice per condition in one biological replicate. Mean + /- s.d. unpaired t-test. (D) Representative hematoxylin and eosin (H and E) images of liver sections of mice in (B–C). Scale bars, 5 mm. (E–H) As shown in (A–D) for Fez1 knock-down. See Figure 4—figure supplement 2E for representative images with N2N1G cells for the quantification in (F–G) of tumors at the surface of the liver. Arrows point to metastases. N = 4–5 mice per condition in one biological replicate. Mean + /- s.d. is shown, unpaired t-test. (I) Diagram of the approach to investigate early steps in liver metastasis, 2 days after intravenous injection. (J–M) Quantification of the number of GFPpositiveN2N1G and 16T mSCLC cells 2 days after intravenous injection. See Figure 4—figure supplement 2F-ID for representative flow cytometry. N = 5 mice per condition in one biological replicate. Mean + /- s.d., unpaired t-test.

Figure 4.

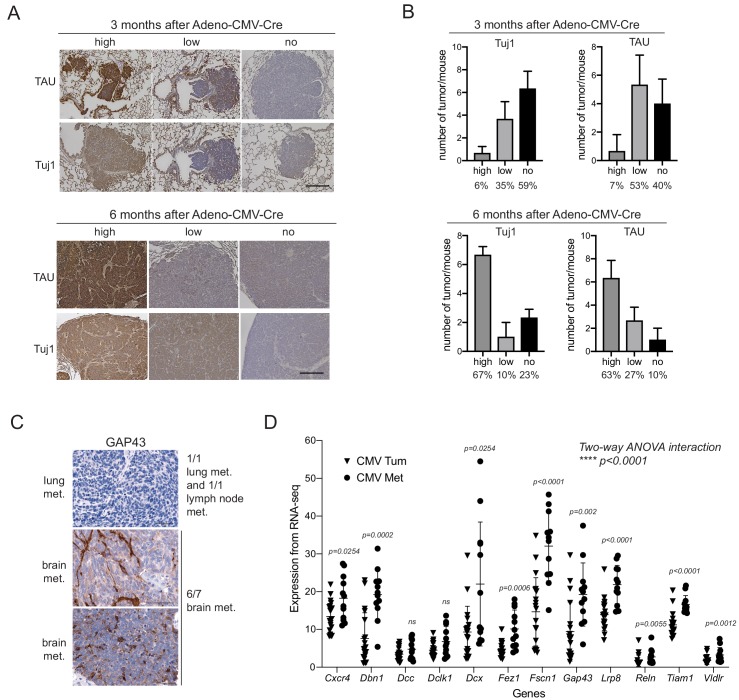
Figure 4—figure supplement 1. Increased expression of axonal markers in metastatic SCLC.

Figure 4—figure supplement 1.

(A) Representative images of immunohistochemistry experiments on lung sections from TKO mice 3 months and 6 months after SCLC initiation with Ad-CMV-Cre. None of the mice had metastases at the 3 month time point while all the mice analyzed had evidence of metastasis at the 6 month time point. The Tuj1 antibody marks neuronal tubulin and TAU is a marker of axons. Hematoxylin was used as a counterstain (purple). Scale bar, 100 μm. (B) Quantification of (A), with N = 30–32 tumors analyzed from N = 3 mice at the 3 month time point and N = 30 tumors analyzed from N = 3 mice at the 6 month time point. Percentages are indicated. (C) Images of GAP43 immunohistochemistry experiments for representative metastases. Hematoxylin was used as a counterstain (purple). Out of 9 metastases analyzed, six showed positive staining for GAP43. Scale bar, 100 μm. (D) Analysis of the expression of 12/13 genes in the selected list of genes involved in axonogenesis and neuronal migration comparing metastases to primary tumors in the Adeno-CMV-Cre TKO mouse model (from Supplementary file 2–table 2 and from Denny et al., 2016, and Yang et al., 2018). The two groups (primary tumors ‘CMV Tum’ and metastases ‘CMV Met’) were first compared by two-way ANOVA and then each gene was compared by t-test.
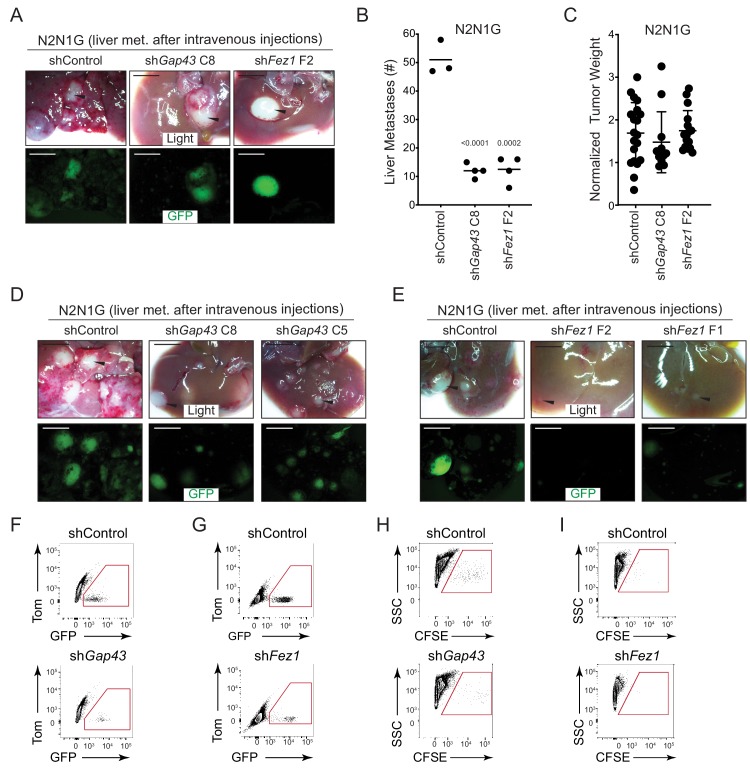
Figure 4—figure supplement 2. Reduced formation of metastasis upon knock-down of GAP43 and FEZ1 in SCLC cells.

Figure 4—figure supplement 2.

(A) Representative live and epifluorescence images (GFP, green) of liver section of mice 4 weeks after intravenous injection of GFP-positive N2N1G mSCLC cells, with control knock-down or knock-down of Gap43 or Fez1. Arrows point to metastases. Scale bars, 5 mm. (B) Quantification of (A). The bar is the mean, unpaired t-test. (C) Quantification of tumor weight after subcutaneous injection of control and knock-down N2N1G cells. Values are not statistically significant by t-test. (D–E) Representative bright light and epifluorescence images (GFP, green) of livers from mice 4 weeks after intravenous injection of GFP-positive N2N1G mSCLC cells, with control knock-down or knock-down of Gap43 or Fez1. Arrows point to metastases. Scale bars, 5 mm. (F–G) Representative flow cytometry quantification of GFP-positive N2N1G cells in the liver 2 days after intravenous injection. (H–I) Representative flow cytometry quantification of CFSE-labeled 16 T cells in the liver 2 days after intravenous injection.