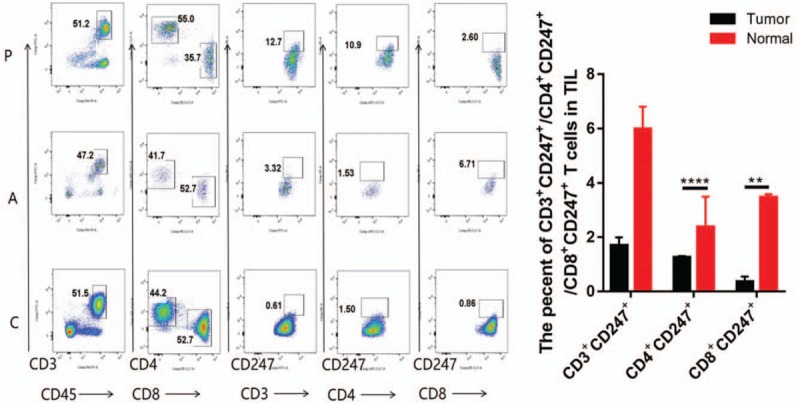
Figure 2.

CD3+CD45+, CD3+CD247+, CD4+CD247+, and CD8+CD247+T-cell detection with flow cytometry is shown. C = Tumor-infiltrating lymphocyte (TIL) from ovarian cancer tissues, A = TIL from adjacent tissues, P = T cells from peripheral blood mononuclear cell with ovarian cancer. Results are presented as mean ± standard deviation. ∗P < .05, ∗∗P < .01 (Student t test).
