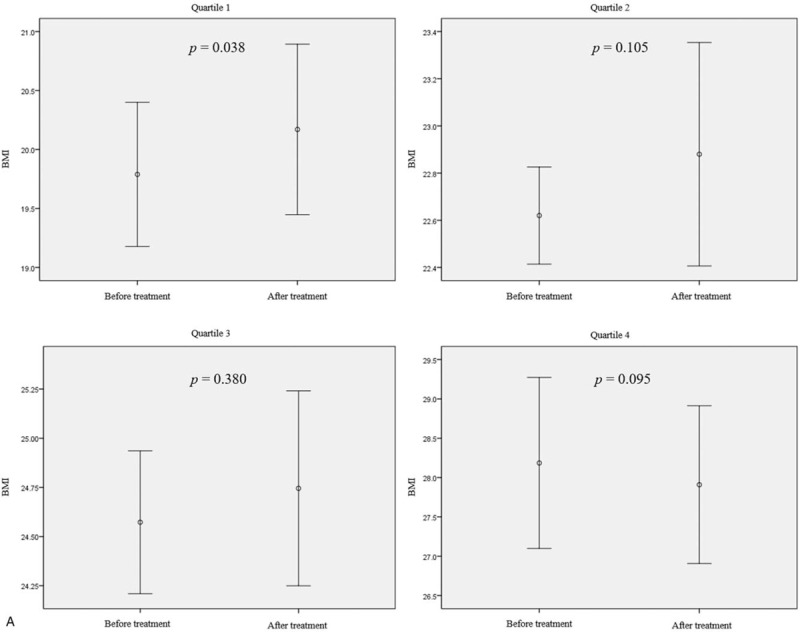
Figure 2.

Body mass index (BMI) and body weight changes after treatment with rifaximin in patient groups by pretreatment BMI or body weight quartile. (a and b) The BMI and body weight changes according to quartiles of BMI or body weight in patients with negative LHBTs after rifaximin treatment (n = 83). (c and d) BMI and body weight changes according to the BMI or body weight quartile in patients who had sustained positive LHBT results after 12 wk of rifaximin treatment (n = 70). Mean differences: (a) Q1, +0.40 ± 0.62; Q2, +0.26 ± 0.84; Q3, +0.17 ± 0.81; Q4, −0.28 ± 0.61. (b) Q1, +0.6 ± 1.1; Q2, +0.2 ± 2.7; Q3, +0.6 ± 2.4; Q4, −0.3 ± 1.4. (c) +0.17 ± 0.42; Q2, +0.00 ± 0.57; Q3, +0.21 ± 0.51; Q4, −0.20 ± 0.84. (d) +0.5 ± 0.9; Q2, −0.4 ± 0.6; Q3, −0.6 ± 2.2; Q4, +0.1 ± 1.1. Mean differences are expressed as mean ± standard deviation. P-value was calculated using the paired t-test. BMI = body mass index, LHBT(−) = negative lactulose hydrogen breath test, LHBT(+) = positive lactulose hydrogen breath test, Q1 = 1st quartile, Q2 = 2nd quartile, Q3 = 3rd quartile, Q4 = 4th quartile.
